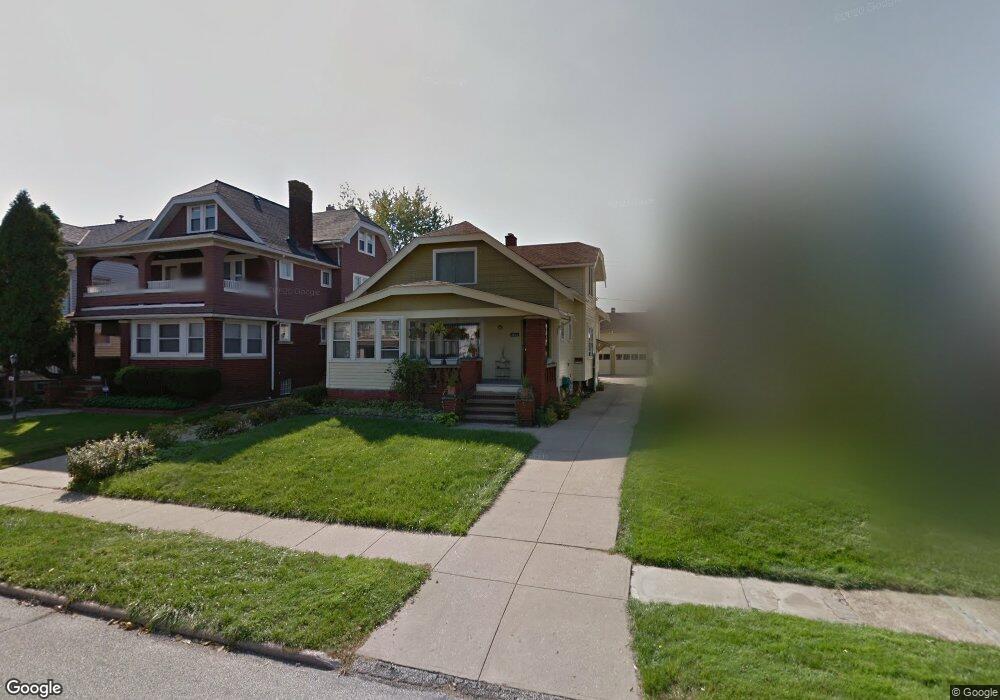
4862 E 97th St Cleveland, OH 44125
Estimated Value: $132,000 - $170,000
4
Beds
2
Baths
1,737
Sq Ft
$83/Sq Ft
Est. Value
About This Home
This home is located at 4862 E 97th St, Cleveland, OH 44125 and is currently estimated at $144,859, approximately $83 per square foot. 4862 E 97th St is a home located in Cuyahoga County with nearby schools including Garfield Heights High School, North Shore High School, and Holy Name Elementary School.
Ownership History
Date
Name
Owned For
Owner Type
Purchase Details
Closed on
May 22, 2001
Sold by
Jackson James E
Bought by
Carter Djarnett
Current Estimated Value
Home Financials for this Owner
Home Financials are based on the most recent Mortgage that was taken out on this home.
Original Mortgage
$104,139
Outstanding Balance
$39,461
Interest Rate
7.23%
Mortgage Type
FHA
Estimated Equity
$105,398
Purchase Details
Closed on
Feb 24, 1999
Sold by
Wyand Sheila Jean
Bought by
Jackson James E and Jackson Heather K
Home Financials for this Owner
Home Financials are based on the most recent Mortgage that was taken out on this home.
Original Mortgage
$90,250
Interest Rate
6.92%
Purchase Details
Closed on
Mar 9, 1976
Sold by
Steiger Viola C
Bought by
Collins Edna H
Purchase Details
Closed on
Aug 5, 1975
Sold by
Smith Gertrude
Bought by
Steiger Viola C
Purchase Details
Closed on
Jan 1, 1975
Bought by
Smith Gertrude
Create a Home Valuation Report for This Property
The Home Valuation Report is an in-depth analysis detailing your home's value as well as a comparison with similar homes in the area
Home Values in the Area
Average Home Value in this Area
Purchase History
| Date | Buyer | Sale Price | Title Company |
|---|---|---|---|
| Carter Djarnett | $105,000 | Title Xperts Agency Inc | |
| Jackson James E | $95,000 | Title Xperts Agency Inc | |
| Collins Edna H | $16,000 | -- | |
| Steiger Viola C | -- | -- | |
| Smith Gertrude | -- | -- |
Source: Public Records
Mortgage History
| Date | Status | Borrower | Loan Amount |
|---|---|---|---|
| Open | Carter Djarnett | $104,139 | |
| Previous Owner | Jackson James E | $90,250 |
Source: Public Records
Tax History
| Year | Tax Paid | Tax Assessment Tax Assessment Total Assessment is a certain percentage of the fair market value that is determined by local assessors to be the total taxable value of land and additions on the property. | Land | Improvement |
|---|---|---|---|---|
| 2024 | $4,662 | $46,130 | $7,840 | $38,290 |
| 2023 | $3,209 | $28,990 | $5,360 | $23,630 |
| 2022 | $3,165 | $28,980 | $5,360 | $23,630 |
| 2021 | $3,345 | $28,980 | $5,360 | $23,630 |
| 2020 | $2,870 | $23,170 | $4,270 | $18,900 |
| 2019 | $2,844 | $66,200 | $12,200 | $54,000 |
| 2018 | $2,963 | $23,170 | $4,270 | $18,900 |
| 2017 | $2,782 | $21,180 | $3,430 | $17,750 |
| 2016 | $2,822 | $21,180 | $3,430 | $17,750 |
| 2015 | $3,108 | $21,180 | $3,430 | $17,750 |
| 2014 | $3,108 | $25,840 | $4,170 | $21,670 |
Source: Public Records
Map
Nearby Homes
- 4839 E 94th St
- 4864 E 94th St
- 4748 E 94th St
- 9435 Dorothy Ave
- 10105 Russell Ave
- 4723 E 94th St
- 9717 David Rd
- 9717 Alexander Rd
- 10105 Greenview Ave
- 10201 Greenview Ave
- 9722 Robinson Ave
- 9516 Alexander Rd
- 4690 E 90th St
- 9518 Plymouth Ave
- 4885 E 107th St
- 10201 Robinson Ave
- 9809 Sladden Ave
- 4643 E 90th St
- 10609 Wadsworth Ave
- 9612 Park Heights Ave
- 4858 E 97th St
- 4866 E 97th St
- 4872 E 97th St
- 4854 E 97th St
- 4850 E 97th St
- 4876 E 97th St
- 4819 E 96th St
- 4823 E 96th St
- 4815 E 96th St
- 4811 E 96th St
- 4871 E 96th St
- 4880 E 97th St
- 4855 E 97th St
- 4875 E 96th St
- 4871 E 97th St
- 9612 Garfield Blvd
- 4882 E 97th St
- 9616 Garfield Blvd
- 4879 E 96th St
- 4875 E 97th St
Your Personal Tour Guide
Ask me questions while you tour the home.