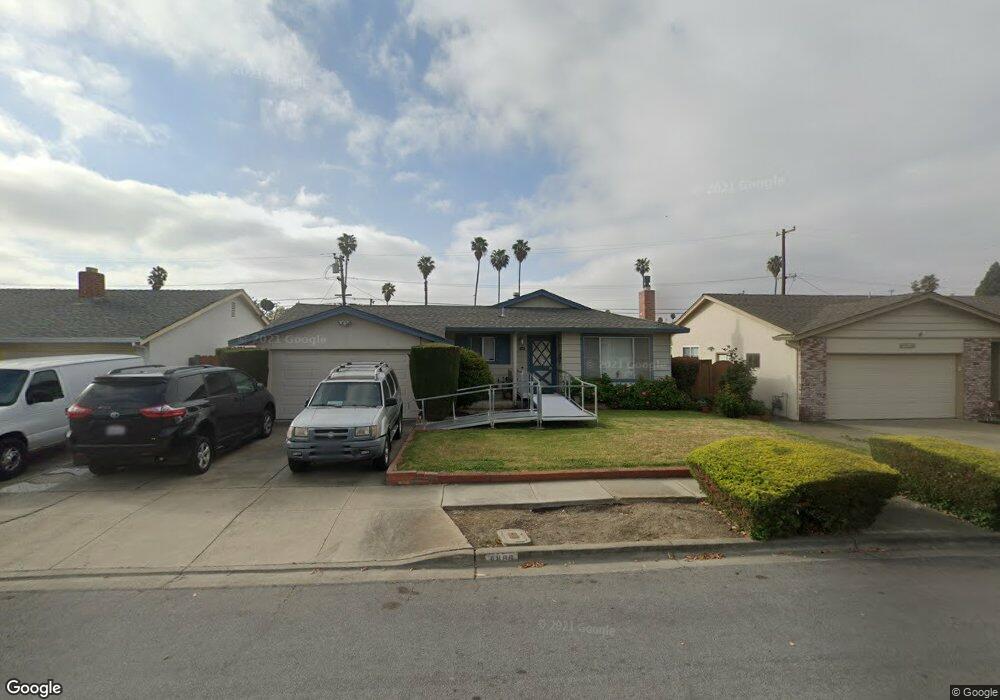
4866 Nelson St Fremont, CA 94538
Sundale NeighborhoodEstimated Value: $1,102,000 - $1,361,000
3
Beds
2
Baths
1,131
Sq Ft
$1,098/Sq Ft
Est. Value
About This Home
This home is located at 4866 Nelson St, Fremont, CA 94538 and is currently estimated at $1,241,889, approximately $1,098 per square foot. 4866 Nelson St is a home located in Alameda County with nearby schools including Joseph Azevada Elementary School, G.M. Walters Middle School, and John F. Kennedy High School.
Ownership History
Date
Name
Owned For
Owner Type
Purchase Details
Closed on
Jul 25, 2022
Sold by
Edward Walker
Bought by
Edward E Walker Trust
Current Estimated Value
Purchase Details
Closed on
Dec 15, 2020
Sold by
Walker Edward E and The Edward E Walker Trust
Bought by
Walker Edward
Home Financials for this Owner
Home Financials are based on the most recent Mortgage that was taken out on this home.
Original Mortgage
$300,000
Interest Rate
2.7%
Mortgage Type
New Conventional
Purchase Details
Closed on
Oct 28, 2014
Sold by
Walker Edward
Bought by
Walker Edward and Edward E Walker Trust
Purchase Details
Closed on
Jun 16, 1995
Sold by
Badillo Rodolfo
Bought by
Walker Edward
Purchase Details
Closed on
May 19, 1995
Sold by
Magill Devera
Bought by
Walker Edward
Create a Home Valuation Report for This Property
The Home Valuation Report is an in-depth analysis detailing your home's value as well as a comparison with similar homes in the area
Home Values in the Area
Average Home Value in this Area
Purchase History
| Date | Buyer | Sale Price | Title Company |
|---|---|---|---|
| Edward E Walker Trust | -- | None Listed On Document | |
| Walker Edward | -- | Solidifi Title & Closing | |
| Walker Edward | -- | None Available | |
| Walker Edward | -- | American Title Insurance Co | |
| Badillo Rodolfo | -- | American Title Insurance Co | |
| Walker Edward | -- | American Title Co |
Source: Public Records
Mortgage History
| Date | Status | Borrower | Loan Amount |
|---|---|---|---|
| Previous Owner | Walker Edward | $300,000 |
Source: Public Records
Tax History Compared to Growth
Tax History
| Year | Tax Paid | Tax Assessment Tax Assessment Total Assessment is a certain percentage of the fair market value that is determined by local assessors to be the total taxable value of land and additions on the property. | Land | Improvement |
|---|---|---|---|---|
| 2025 | $4,422 | $324,164 | $97,249 | $226,915 |
| 2024 | $4,422 | $317,808 | $95,342 | $222,466 |
| 2023 | $4,290 | $311,578 | $93,473 | $218,105 |
| 2022 | $4,215 | $305,470 | $91,641 | $213,829 |
| 2021 | $4,118 | $299,481 | $89,844 | $209,637 |
| 2020 | $4,065 | $296,410 | $88,923 | $207,487 |
| 2019 | $4,023 | $290,600 | $87,180 | $203,420 |
| 2018 | $3,942 | $284,901 | $85,470 | $199,431 |
| 2017 | $3,845 | $279,317 | $83,795 | $195,522 |
| 2016 | $3,770 | $273,841 | $82,152 | $191,689 |
| 2015 | $3,711 | $269,728 | $80,918 | $188,810 |
| 2014 | $3,640 | $264,446 | $79,334 | $185,112 |
Source: Public Records
Map
Nearby Homes
- 4692 Nelson St
- 4737 Boone Dr
- 4714 Serra Ave
- 4600 Nelson St
- 5033 Blacksand Rd
- 39530 Dorrington Ct
- 5330 Coco Palm Dr
- 5589 Roosevelt Place
- 5580 Hemlock Terrace
- 39090 Presidio Way Unit 237
- 40116 Crockett St
- 5624 Chestnut Common
- 4840 Piper St
- 4715 Mildred Dr
- 39753 Placer Way
- 39751 Bissy Common
- 4572 De Silva St
- 40422 Landon Ave
- 4453 Porter St
- 38976 Primula Terrace
- 4858 Nelson St
- 4874 Nelson St
- 4850 Nelson St
- 4882 Nelson St
- 4865 Nelson St
- 4873 Nelson St
- 4842 Nelson St
- 4857 Nelson St
- 4867 Coco Palm Dr
- 4890 Nelson St
- 4875 Coco Palm Dr
- 4859 Coco Palm Dr
- 4881 Nelson St
- 4883 Coco Palm Dr
- 39595 Eric St
- 4851 Coco Palm Dr
- 4834 Nelson St
- 4898 Nelson St
- 4905 Coco Palm Dr
- 4843 Coco Palm Dr