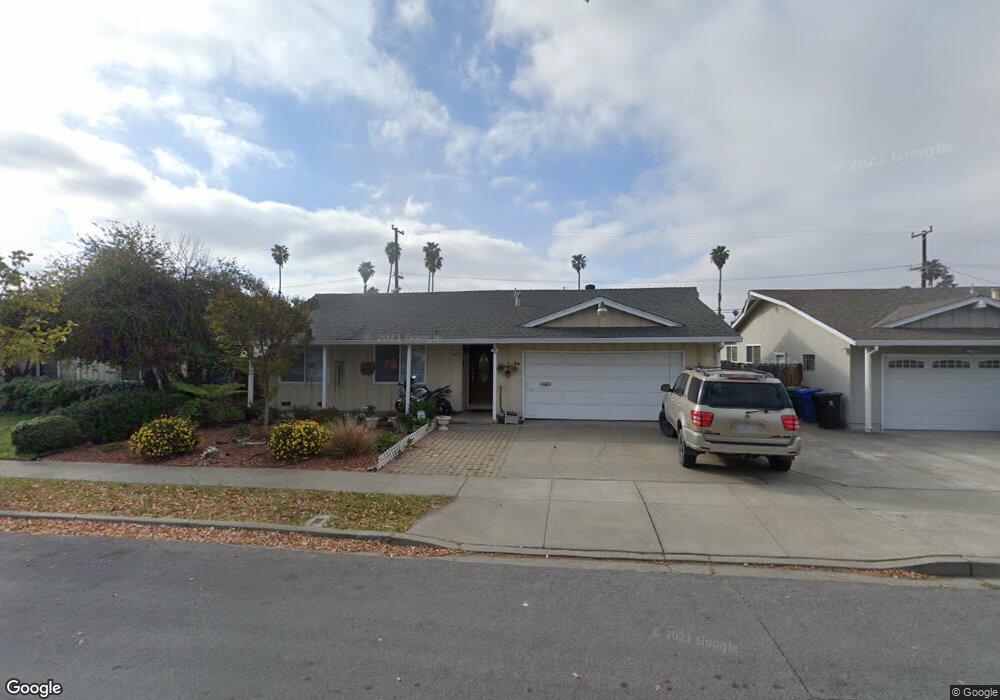
4882 Nelson St Fremont, CA 94538
Sundale NeighborhoodEstimated Value: $1,252,000 - $1,721,000
4
Beds
3
Baths
2,079
Sq Ft
$731/Sq Ft
Est. Value
About This Home
This home is located at 4882 Nelson St, Fremont, CA 94538 and is currently estimated at $1,519,917, approximately $731 per square foot. 4882 Nelson St is a home located in Alameda County with nearby schools including Joseph Azevada Elementary School, G.M. Walters Middle School, and John F. Kennedy High School.
Ownership History
Date
Name
Owned For
Owner Type
Purchase Details
Closed on
Aug 26, 2013
Sold by
Gill Gurbinder K and Sidhu Bhupinder K
Bought by
Sidhu Bhupinder K and Sidhu Nirlep K
Current Estimated Value
Home Financials for this Owner
Home Financials are based on the most recent Mortgage that was taken out on this home.
Original Mortgage
$395,000
Outstanding Balance
$287,015
Interest Rate
3.75%
Mortgage Type
Adjustable Rate Mortgage/ARM
Estimated Equity
$1,232,902
Purchase Details
Closed on
Mar 8, 2010
Sold by
Sidhu Mohinder
Bought by
Sidhu Bhupinder
Purchase Details
Closed on
Jul 13, 2009
Sold by
Gill Kulwant
Bought by
Gill Gurbinder K
Home Financials for this Owner
Home Financials are based on the most recent Mortgage that was taken out on this home.
Original Mortgage
$407,814
Interest Rate
5.31%
Mortgage Type
FHA
Purchase Details
Closed on
Apr 2, 1996
Sold by
Semaan Anthony J and Semaan Najwa Rita Mourad
Bought by
Jo & I Properties
Create a Home Valuation Report for This Property
The Home Valuation Report is an in-depth analysis detailing your home's value as well as a comparison with similar homes in the area
Home Values in the Area
Average Home Value in this Area
Purchase History
| Date | Buyer | Sale Price | Title Company |
|---|---|---|---|
| Sidhu Bhupinder K | $197,500 | First American Title Company | |
| Sidhu Bhupinder | -- | None Available | |
| Gill Gurbinder K | -- | First American Title Company | |
| Sidhu Mohinder | $136,000 | First American Title Company | |
| Jo & I Properties | $188,000 | -- |
Source: Public Records
Mortgage History
| Date | Status | Borrower | Loan Amount |
|---|---|---|---|
| Open | Sidhu Bhupinder K | $395,000 | |
| Previous Owner | Sidhu Mohinder | $407,814 |
Source: Public Records
Tax History
| Year | Tax Paid | Tax Assessment Tax Assessment Total Assessment is a certain percentage of the fair market value that is determined by local assessors to be the total taxable value of land and additions on the property. | Land | Improvement |
|---|---|---|---|---|
| 2025 | $4,598 | $340,181 | $152,826 | $194,355 |
| 2024 | $4,598 | $333,375 | $149,830 | $190,545 |
| 2023 | $4,460 | $333,701 | $146,892 | $186,809 |
| 2022 | $4,383 | $320,160 | $144,013 | $183,147 |
| 2021 | $4,279 | $313,745 | $141,189 | $179,556 |
| 2020 | $4,228 | $317,457 | $139,742 | $177,715 |
| 2019 | $4,182 | $311,233 | $137,002 | $174,231 |
| 2018 | $4,097 | $305,133 | $134,317 | $170,816 |
| 2017 | $3,994 | $299,151 | $131,684 | $167,467 |
| 2016 | $3,916 | $293,286 | $129,102 | $164,184 |
| 2015 | $3,853 | $288,883 | $127,164 | $161,719 |
| 2014 | $3,779 | $283,225 | $124,673 | $158,552 |
Source: Public Records
Map
Nearby Homes
- 39630 Blacow Rd
- 39511 Pardee Ct
- 4833 Murphy Ct
- 4657 Pardee Ave
- 5132 Trade Wind Ln
- 4789 Calaveras Ave
- 4600 Nelson St
- 4714 Serra Ave
- 39151 Donner Way
- 4754 Bret Harte Ct
- 5592 Dewey Place
- 4369 Amador Rd
- 4531 Stevenson Blvd
- 4508 Stevenson Blvd
- 39773 Costa Way
- 39904 Lindsay Mcdermott Ln Unit 8
- 40327 Blacow Rd
- 4859 Hilo St
- 39583 Buena Vista Terrace
- 38952 Emrol Ave
- 4890 Nelson St
- 4874 Nelson St
- 4866 Nelson St
- 4898 Nelson St
- 4881 Nelson St
- 4873 Nelson St
- 4858 Nelson St
- 4883 Coco Palm Dr
- 4906 Nelson St
- 4905 Coco Palm Dr
- 4875 Coco Palm Dr
- 39535 Yuba Ct
- 4865 Nelson St
- 4923 Coco Palm Dr
- 4867 Coco Palm Dr
- 4850 Nelson St
- 39554 Yuba Ct
- 4857 Nelson St
- 4914 Nelson St
- 4941 Coco Palm Dr
Your Personal Tour Guide
Ask me questions while you tour the home.