
Seller's Agent in 2026
Fred Sengstacke
KAIZEN Realty, LLC
(901) 674-0837
2 in this area
46 Total Sales
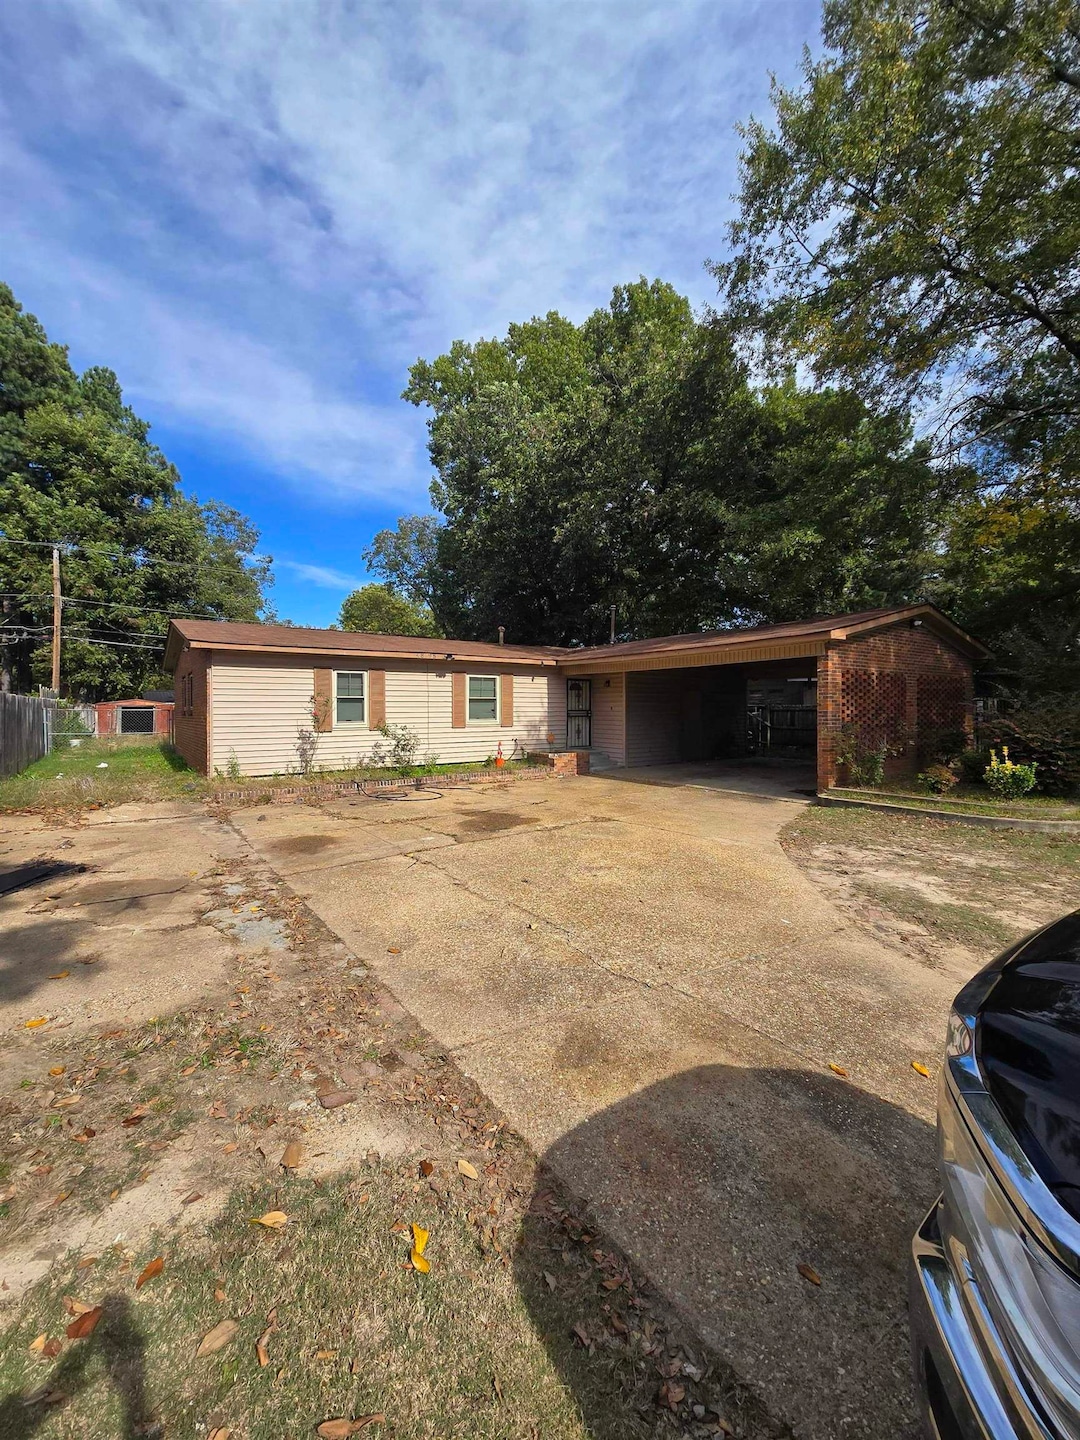


This home is located at 4898 Knight Arnold Rd, Memphis, TN 38118 and is currently priced at $116,523, approximately $90 per square foot. This property was built in 1960. 4898 Knight Arnold Rd is a home located in Shelby County with nearby schools including Evans Elementary School, Wooddale High School, and Cornerstone Prep School.
Last Agent to Sell the Property
KAIZEN Realty, LLC License #320751 Listed on: 11/07/2025
| Date | Type | Sale Price | Title Company |
|---|---|---|---|
| Warranty Deed | $116,523 | None Listed On Document | |
| Quit Claim Deed | -- | -- | |
| Warranty Deed | $92,500 | None Listed On Document | |
| Trustee Deed | $60,300 | -- | |
| Deed | $63,457 | -- |
| Date | Status | Loan Amount | Loan Type |
|---|---|---|---|
| Previous Owner | $119,000 | New Conventional | |
| Previous Owner | $96,558 | New Conventional |
| Date | Event | Price | List to Sale | Price per Sq Ft |
|---|---|---|---|---|
| 02/27/2026 02/27/26 | Sold | $116,523 | -8.9% | $90 / Sq Ft |
| 01/18/2026 01/18/26 | Price Changed | $127,900 | -1.5% | $99 / Sq Ft |
| 01/12/2026 01/12/26 | Price Changed | $129,900 | -2.3% | $101 / Sq Ft |
| 01/05/2026 01/05/26 | Price Changed | $132,900 | -1.5% | $103 / Sq Ft |
| 11/07/2025 11/07/25 | For Sale | $134,900 | -- | $105 / Sq Ft |
| Year | Tax Paid | Tax Assessment Tax Assessment Total Assessment is a certain percentage of the fair market value that is determined by local assessors to be the total taxable value of land and additions on the property. | Land | Improvement |
|---|---|---|---|---|
| 2025 | $656 | $30,400 | $4,000 | $26,400 |
| 2024 | $656 | $19,350 | $3,000 | $16,350 |
| 2023 | $1,179 | $19,350 | $3,000 | $16,350 |
| 2022 | $1,179 | $19,350 | $3,000 | $16,350 |
| 2021 | $1,193 | $19,350 | $3,000 | $16,350 |
| 2020 | $1,101 | $15,200 | $3,000 | $12,200 |
| 2019 | $486 | $15,200 | $3,000 | $12,200 |
| 2018 | $486 | $15,200 | $3,000 | $12,200 |
| 2017 | $497 | $15,200 | $3,000 | $12,200 |
| 2016 | $646 | $14,775 | $0 | $0 |
| 2014 | $627 | $14,350 | $0 | $0 |
Seller's Agent in 2026
Fred Sengstacke
KAIZEN Realty, LLC
(901) 674-0837
2 in this area
46 Total Sales
Buyer's Agent in 2026
Itzel Sanchez Bustamante
Keller Williams
(901) 378-4334
83 in this area
591 Total Sales
R
Buyer Co-Listing Agent in 2026
Rene Sanchez Bustamante
Keller Williams
(901) 431-3836
39 in this area
213 Total Sales
Source: Memphis Area Association of REALTORS®
MLS Number: 10209347
APN: 07-4015-0-0037
Disclaimer: Certain information contained herein is derived from information provided by parties other than Homes.com. All information provided is deemed reliable, but is not guaranteed to be accurate and should be independently verified.
![]() Listing content and images Copyright 2026 Memphis Area Association of REALTORS®. Information provided is for the consumer’s personal, non-commercial use and may not be used for any purpose other than to identify prospective properties consumers may be interested in purchasing. Do not rely upon listing data without independently verifying it.
Listing content and images Copyright 2026 Memphis Area Association of REALTORS®. Information provided is for the consumer’s personal, non-commercial use and may not be used for any purpose other than to identify prospective properties consumers may be interested in purchasing. Do not rely upon listing data without independently verifying it.
Some or all of the listings displayed may not belong to the firm whose website is being visited.
Ask me questions while you tour the home.