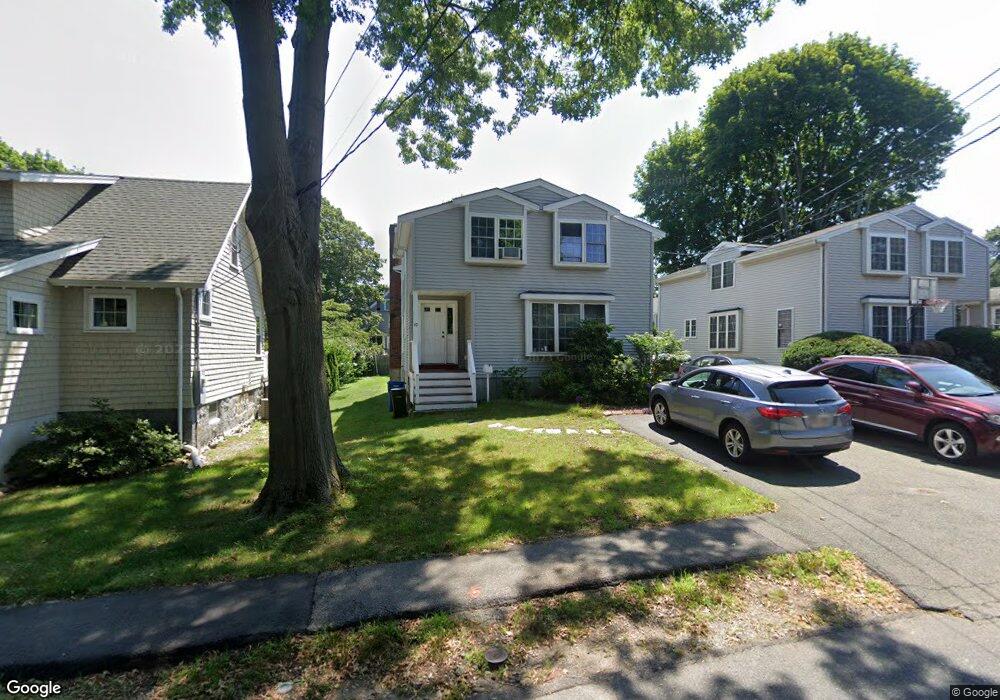
49 Franklin St Milton, MA 02186
Estimated Value: $998,000 - $1,267,000
4
Beds
3
Baths
1,946
Sq Ft
$570/Sq Ft
Est. Value
About This Home
This home is located at 49 Franklin St, Milton, MA 02186 and is currently estimated at $1,109,174, approximately $569 per square foot. 49 Franklin St is a home located in Norfolk County with nearby schools including Milton High School, St. Agatha School, and Adams Montessori School.
Ownership History
Date
Name
Owned For
Owner Type
Purchase Details
Closed on
Dec 21, 2023
Sold by
Poon Dickson T and Poon Donice S
Bought by
Poon
Current Estimated Value
Purchase Details
Closed on
Aug 4, 2000
Sold by
Franklin St Rt
Bought by
Poon Donice Sw and Poon Dickson T
Home Financials for this Owner
Home Financials are based on the most recent Mortgage that was taken out on this home.
Original Mortgage
$100,000
Interest Rate
8.1%
Mortgage Type
Purchase Money Mortgage
Purchase Details
Closed on
Feb 1, 2000
Sold by
Gruner Coll N
Bought by
Franklin St Rt
Home Financials for this Owner
Home Financials are based on the most recent Mortgage that was taken out on this home.
Original Mortgage
$225,000
Interest Rate
7.83%
Mortgage Type
Purchase Money Mortgage
Create a Home Valuation Report for This Property
The Home Valuation Report is an in-depth analysis detailing your home's value as well as a comparison with similar homes in the area
Home Values in the Area
Average Home Value in this Area
Purchase History
| Date | Buyer | Sale Price | Title Company |
|---|---|---|---|
| Poon | -- | None Available | |
| Poon Donice Sw | $345,000 | -- | |
| Franklin St Rt | $100,000 | -- |
Source: Public Records
Mortgage History
| Date | Status | Borrower | Loan Amount |
|---|---|---|---|
| Previous Owner | Franklin St Rt | $100,000 | |
| Previous Owner | Franklin St Rt | $225,000 |
Source: Public Records
Tax History Compared to Growth
Tax History
| Year | Tax Paid | Tax Assessment Tax Assessment Total Assessment is a certain percentage of the fair market value that is determined by local assessors to be the total taxable value of land and additions on the property. | Land | Improvement |
|---|---|---|---|---|
| 2025 | $10,362 | $934,400 | $462,700 | $471,700 |
| 2024 | $10,092 | $924,200 | $440,700 | $483,500 |
| 2023 | $9,952 | $873,000 | $420,000 | $453,000 |
| 2022 | $9,656 | $774,300 | $420,000 | $354,300 |
| 2021 | $9,299 | $708,200 | $367,400 | $340,800 |
| 2020 | $8,563 | $652,700 | $316,800 | $335,900 |
| 2019 | $8,352 | $633,700 | $307,600 | $326,100 |
| 2018 | $8,149 | $590,100 | $266,000 | $324,100 |
| 2017 | $7,622 | $562,100 | $253,300 | $308,800 |
| 2016 | $7,514 | $556,600 | $253,300 | $303,300 |
| 2015 | $7,469 | $535,800 | $233,300 | $302,500 |
Source: Public Records
Map
Nearby Homes
- 60 Pond St
- 11 Rockwell Ave
- 51 Denmark Ave
- 41 Wallace Rd
- 171 Milton St
- 55 Christopher Dr
- 397 Adams St
- 400 Adams St Unit A
- 400 Adams St Unit B
- 129-131 Pine St
- 169 Pine St
- 71 Cabot St
- 121 Hillside Ave
- 66 Unity St
- 639 Pleasant St Unit 639
- 639 Pleasant St
- 10 White St
- 1111 Brook Rd
- 73 Connell St
- 46 Century Ln