49 Lowell Rd Hudson, NH 03051
Estimated Value: $2,311,377
--
Bed
--
Bath
4,238
Sq Ft
$545/Sq Ft
Est. Value
About This Home
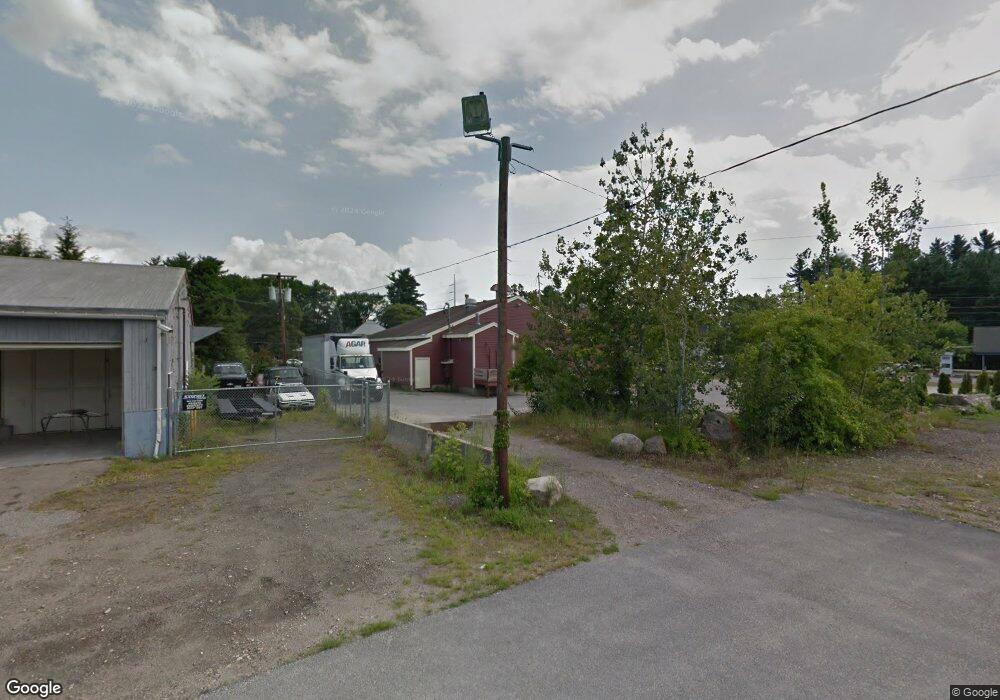
This home is located at 49 Lowell Rd, Hudson, NH 03051 and is currently estimated at $2,311,377, approximately $545 per square foot. 49 Lowell Rd is a home located in Hillsborough County with nearby schools including Presentation of Mary Academy, White Wing School, and Clearway High School.
Ownership History
Date
Name
Owned For
Owner Type
Purchase Details
Closed on
Oct 1, 2014
Sold by
Ptjtj Mgmt
Bought by
J & R Brothers Llc
Current Estimated Value
Purchase Details
Closed on
Sep 14, 2007
Sold by
Logio Inc
Bought by
Ptjtj Management Llc
Home Financials for this Owner
Home Financials are based on the most recent Mortgage that was taken out on this home.
Original Mortgage
$513,500
Interest Rate
6.7%
Mortgage Type
Commercial
Purchase Details
Closed on
Apr 30, 2004
Sold by
Jaygreg Rt
Bought by
Logio Inc
Home Financials for this Owner
Home Financials are based on the most recent Mortgage that was taken out on this home.
Original Mortgage
$810,000
Interest Rate
5.36%
Mortgage Type
Commercial
Create a Home Valuation Report for This Property
The Home Valuation Report is an in-depth analysis detailing your home's value as well as a comparison with similar homes in the area
Home Values in the Area
Average Home Value in this Area
Purchase History
| Date | Buyer | Sale Price | Title Company |
|---|---|---|---|
| J & R Brothers Llc | $950,000 | -- | |
| J & R Brothers Llc | $950,000 | -- | |
| Ptjtj Management Llc | $880,000 | -- | |
| Ptjtj Management Llc | $880,000 | -- | |
| Logio Inc | $900,000 | -- | |
| Logio Inc | $900,000 | -- |
Source: Public Records
Mortgage History
| Date | Status | Borrower | Loan Amount |
|---|---|---|---|
| Previous Owner | Logio Inc | $513,500 | |
| Previous Owner | Logio Inc | $810,000 |
Source: Public Records
Tax History Compared to Growth
Tax History
| Year | Tax Paid | Tax Assessment Tax Assessment Total Assessment is a certain percentage of the fair market value that is determined by local assessors to be the total taxable value of land and additions on the property. | Land | Improvement |
|---|---|---|---|---|
| 2024 | $19,423 | $1,180,700 | $726,300 | $454,400 |
| 2023 | $18,513 | $1,180,700 | $726,300 | $454,400 |
| 2022 | $17,344 | $1,180,700 | $726,300 | $454,400 |
| 2021 | $22,459 | $1,036,400 | $597,200 | $439,200 |
| 2020 | $22,148 | $1,036,400 | $597,200 | $439,200 |
| 2019 | $21,018 | $1,036,400 | $597,200 | $439,200 |
| 2018 | $21,268 | $1,058,100 | $597,200 | $460,900 |
| 2017 | $20,866 | $1,058,100 | $597,200 | $460,900 |
| 2016 | $19,931 | $907,200 | $477,800 | $429,400 |
| 2015 | $19,278 | $907,200 | $477,800 | $429,400 |
| 2014 | $18,897 | $907,200 | $477,800 | $429,400 |
| 2013 | $18,652 | $907,200 | $477,800 | $429,400 |
Source: Public Records
Map
Nearby Homes