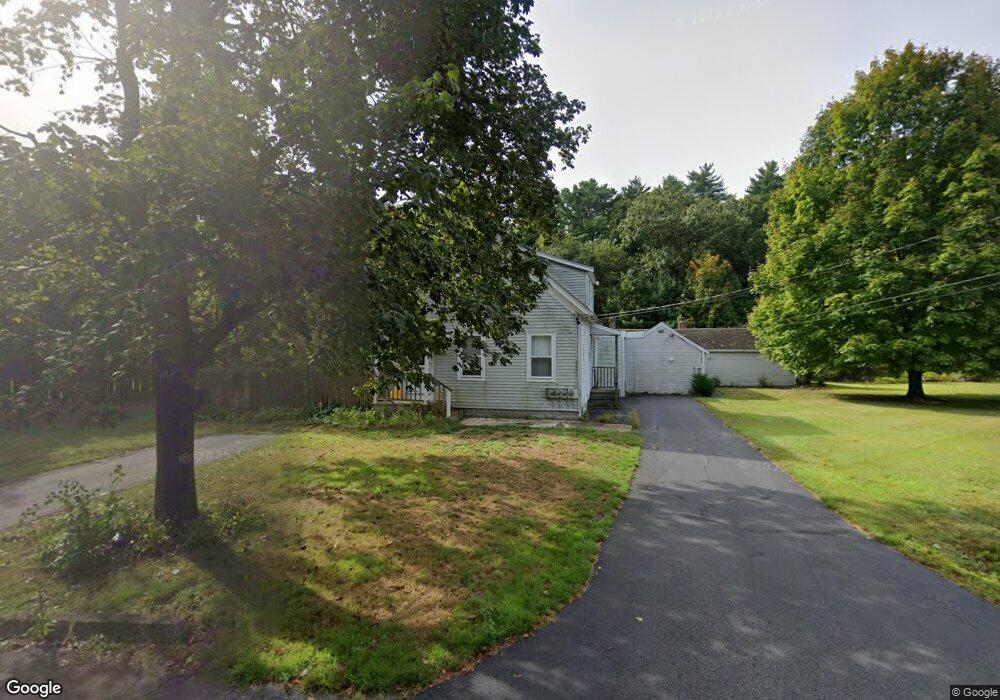
49 Maple Ave Hanover, MA 02339
Estimated Value: $587,000 - $786,000
4
Beds
2
Baths
2,084
Sq Ft
$322/Sq Ft
Est. Value
About This Home
This home is located at 49 Maple Ave, Hanover, MA 02339 and is currently estimated at $671,719, approximately $322 per square foot. 49 Maple Ave is a home located in Plymouth County with nearby schools including Hanover High School and Holy Family Elementary School.
Ownership History
Date
Name
Owned For
Owner Type
Purchase Details
Closed on
Nov 6, 2013
Sold by
Ferguson Hugh R and Ferguson Pamela D
Bought by
Ferguson Pamela D
Current Estimated Value
Purchase Details
Closed on
Jan 2, 1992
Sold by
Robinson Ft
Bought by
Ferguson Hugh R and Ferguson Pamela D
Home Financials for this Owner
Home Financials are based on the most recent Mortgage that was taken out on this home.
Original Mortgage
$70,000
Interest Rate
8.56%
Mortgage Type
Purchase Money Mortgage
Create a Home Valuation Report for This Property
The Home Valuation Report is an in-depth analysis detailing your home's value as well as a comparison with similar homes in the area
Home Values in the Area
Average Home Value in this Area
Purchase History
| Date | Buyer | Sale Price | Title Company |
|---|---|---|---|
| Ferguson Pamela D | -- | -- | |
| Ferguson Pamela D | -- | -- | |
| Ferguson Hugh R | $100,000 | -- | |
| Ferguson Hugh R | $100,000 | -- |
Source: Public Records
Mortgage History
| Date | Status | Borrower | Loan Amount |
|---|---|---|---|
| Previous Owner | Ferguson Hugh R | $70,000 | |
| Previous Owner | Ferguson Hugh R | $128,000 |
Source: Public Records
Tax History
| Year | Tax Paid | Tax Assessment Tax Assessment Total Assessment is a certain percentage of the fair market value that is determined by local assessors to be the total taxable value of land and additions on the property. | Land | Improvement |
|---|---|---|---|---|
| 2025 | $6,462 | $523,200 | $269,400 | $253,800 |
| 2024 | $6,718 | $523,200 | $269,400 | $253,800 |
| 2023 | $6,854 | $508,100 | $244,900 | $263,200 |
| 2022 | $7,715 | $505,900 | $244,900 | $261,000 |
| 2021 | $285 | $472,500 | $211,500 | $261,000 |
| 2020 | $4,983 | $305,500 | $211,500 | $94,000 |
| 2019 | $5,171 | $315,100 | $211,500 | $103,600 |
| 2018 | $5,348 | $328,500 | $211,500 | $117,000 |
| 2017 | $5,128 | $310,400 | $209,400 | $101,000 |
| 2016 | $5,335 | $316,400 | $190,500 | $125,900 |
| 2015 | $4,881 | $302,200 | $190,500 | $111,700 |
Source: Public Records
Map
Nearby Homes
- 36 Bayberry Ln
- 47 Stone Meadow Ln
- 44 Stone Meadow Ln
- 50 Village Ln
- 823 Market St
- 776 Main St
- 506 Main St
- 561 Circuit St
- 9 Old Market St
- 49 Liberty St
- 75 School St
- 117 Liberty St
- 92 Liberty St
- 436 E Water St
- 46 Brookwood Rd
- 62 Larchmont Ln
- 535 Webster St
- 696 Summer St
- 206-208 Hinghm St
- 95 Tecumseh Dr
Your Personal Tour Guide
Ask me questions while you tour the home.