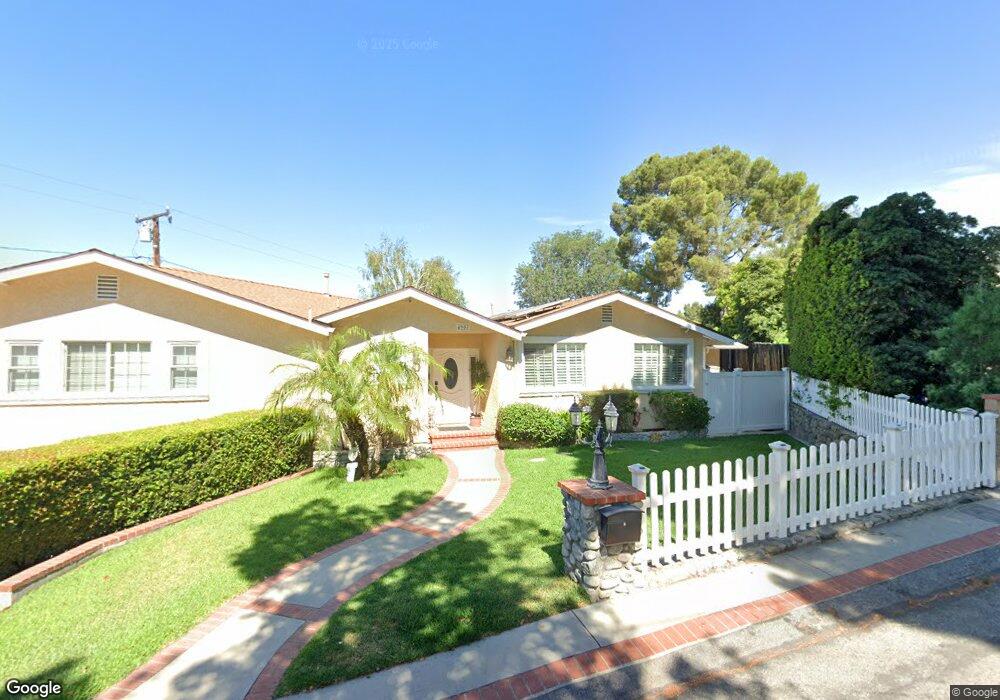
4907 Cloud Ave La Crescenta, CA 91214
Estimated Value: $1,487,000 - $1,925,000
3
Beds
3
Baths
2,977
Sq Ft
$575/Sq Ft
Est. Value
About This Home
This home is located at 4907 Cloud Ave, La Crescenta, CA 91214 and is currently estimated at $1,710,511, approximately $574 per square foot. 4907 Cloud Ave is a home located in Los Angeles County with nearby schools including Valley View Elementary School, Rosemont Middle School, and Crescenta Valley High School.
Ownership History
Date
Name
Owned For
Owner Type
Purchase Details
Closed on
Jul 21, 2020
Sold by
Labellarte Joseph A and Labellarte Tracy F
Bought by
Labellarte Joseph A and Labellarte Tracy F
Current Estimated Value
Home Financials for this Owner
Home Financials are based on the most recent Mortgage that was taken out on this home.
Original Mortgage
$370,000
Outstanding Balance
$314,176
Interest Rate
3%
Mortgage Type
New Conventional
Estimated Equity
$1,396,335
Purchase Details
Closed on
Nov 18, 2013
Sold by
Labellarte Joseph A
Bought by
Labellarte Joseph A and Labellarte Tracy F
Purchase Details
Closed on
Mar 31, 1998
Sold by
Labellarte Joseph
Bought by
Labellarte Joseph A and Labellarte Tracy F
Home Financials for this Owner
Home Financials are based on the most recent Mortgage that was taken out on this home.
Original Mortgage
$170,000
Interest Rate
7%
Create a Home Valuation Report for This Property
The Home Valuation Report is an in-depth analysis detailing your home's value as well as a comparison with similar homes in the area
Home Values in the Area
Average Home Value in this Area
Purchase History
| Date | Buyer | Sale Price | Title Company |
|---|---|---|---|
| Labellarte Joseph A | -- | Provident Title Company | |
| Labellarte Joseph A | -- | None Available | |
| Labellarte Joseph A | -- | Southland Title |
Source: Public Records
Mortgage History
| Date | Status | Borrower | Loan Amount |
|---|---|---|---|
| Open | Labellarte Joseph A | $370,000 | |
| Closed | Labellarte Joseph A | $170,000 |
Source: Public Records
Tax History
| Year | Tax Paid | Tax Assessment Tax Assessment Total Assessment is a certain percentage of the fair market value that is determined by local assessors to be the total taxable value of land and additions on the property. | Land | Improvement |
|---|---|---|---|---|
| 2025 | $8,454 | $724,037 | $240,481 | $483,556 |
| 2024 | $8,454 | $709,841 | $235,766 | $474,075 |
| 2023 | $8,273 | $695,924 | $231,144 | $464,780 |
| 2022 | $7,939 | $682,279 | $226,612 | $455,667 |
| 2021 | $7,795 | $668,902 | $222,169 | $446,733 |
| 2019 | $7,504 | $649,064 | $215,580 | $433,484 |
| 2018 | $7,263 | $636,338 | $211,353 | $424,985 |
| 2016 | $6,912 | $611,630 | $203,147 | $408,483 |
| 2015 | $6,765 | $602,444 | $200,096 | $402,348 |
| 2014 | $6,712 | $590,644 | $196,177 | $394,467 |
Source: Public Records
Map
Nearby Homes
- 3129 Orange Ave
- 4930 Ramsdell Ave
- 3011 Frances Ave
- 3908 Park Place
- 2902 El Caminito
- 3033 Fairesta St
- 5150 La Crescenta Ave
- 4210 New York Ave
- 4620 Willalee Ave
- 3611 4th Ave
- 2620 Sea Pine Ln
- 2829 Willowhaven Dr
- 3417 Encinal Ave
- 5129 New York Ave
- 4208 New York Ave
- 2507 Rockdell St
- 3721 2nd Ave
- 3450 Mevel Place
- 2443 Shields St
- 2423 Rockdell St
- 4913 Cloud Ave
- 3104 Santa Carlotta St
- 3110 Santa Carlotta St
- 3114 Santa Carlotta St
- 3115 Santa Carlotta St
- 3063 Santa Carlotta St
- 3056 Paraiso Way
- 3119 Santa Carlotta St
- 3050 Paraiso Way
- 3118 Santa Carlotta St
- 4921 Cloud Ave
- 3059 Santa Carlotta St
- 3123 Santa Carlotta St
- 3044 Paraiso Way
- 3122 Santa Carlotta St
- 3100 Santa Carlotta St
- 3129 Santa Carlotta St
- 3129 El Caminito
- 3126 Santa Carlotta St
- 3133 El Caminito
Your Personal Tour Guide
Ask me questions while you tour the home.