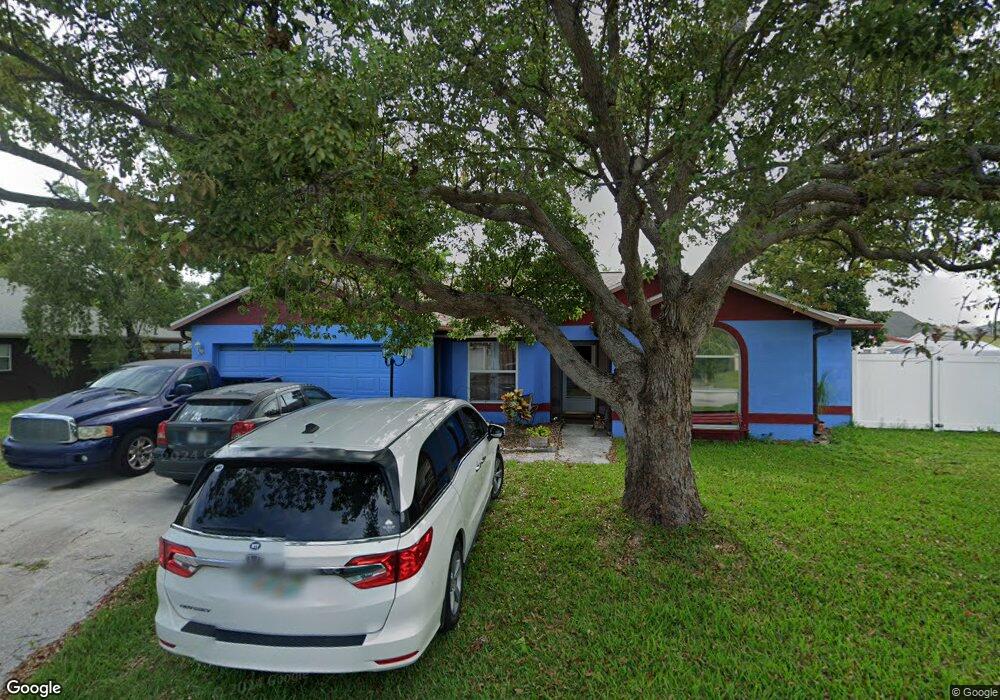
4909 22nd Ct E Bradenton, FL 34203
Samoset NeighborhoodEstimated Value: $313,000 - $388,000
3
Beds
2
Baths
1,338
Sq Ft
$263/Sq Ft
Est. Value
About This Home
This home is located at 4909 22nd Ct E, Bradenton, FL 34203 and is currently estimated at $351,244, approximately $262 per square foot. 4909 22nd Ct E is a home located in Manatee County with nearby schools including Oneco Elementary School, Martha B. King Middle School, and Southeast High School.
Ownership History
Date
Name
Owned For
Owner Type
Purchase Details
Closed on
Feb 13, 2006
Sold by
Carlile Roy A and Carlile Catherine A
Bought by
Wilson James C and Wilson Kristen L
Current Estimated Value
Home Financials for this Owner
Home Financials are based on the most recent Mortgage that was taken out on this home.
Original Mortgage
$200,000
Outstanding Balance
$112,191
Interest Rate
6.14%
Mortgage Type
Fannie Mae Freddie Mac
Estimated Equity
$239,053
Purchase Details
Closed on
Dec 11, 2000
Sold by
Stone Brian L and Stone Sandra D
Bought by
Carlile Roy A and Carlile Catherine A
Home Financials for this Owner
Home Financials are based on the most recent Mortgage that was taken out on this home.
Original Mortgage
$57,000
Interest Rate
7.79%
Purchase Details
Closed on
Jun 9, 1994
Sold by
Peaceful Pines Joint Venture
Bought by
Stone Brian L and Stone Sandra D
Home Financials for this Owner
Home Financials are based on the most recent Mortgage that was taken out on this home.
Original Mortgage
$82,669
Interest Rate
8.27%
Mortgage Type
FHA
Create a Home Valuation Report for This Property
The Home Valuation Report is an in-depth analysis detailing your home's value as well as a comparison with similar homes in the area
Home Values in the Area
Average Home Value in this Area
Purchase History
| Date | Buyer | Sale Price | Title Company |
|---|---|---|---|
| Wilson James C | $265,000 | None Available | |
| Carlile Roy A | $110,000 | -- | |
| Stone Brian L | $84,600 | -- |
Source: Public Records
Mortgage History
| Date | Status | Borrower | Loan Amount |
|---|---|---|---|
| Open | Wilson James C | $200,000 | |
| Previous Owner | Carlile Roy A | $57,000 | |
| Previous Owner | Stone Brian L | $82,669 |
Source: Public Records
Tax History
| Year | Tax Paid | Tax Assessment Tax Assessment Total Assessment is a certain percentage of the fair market value that is determined by local assessors to be the total taxable value of land and additions on the property. | Land | Improvement |
|---|---|---|---|---|
| 2025 | $6,807 | $248,089 | -- | -- |
| 2023 | $6,475 | $282,342 | $45,900 | $236,442 |
| 2022 | $6,065 | $246,772 | $45,000 | $201,772 |
| 2021 | $5,456 | $181,274 | $30,000 | $151,274 |
| 2020 | $5,401 | $174,277 | $30,000 | $144,277 |
| 2019 | $2,626 | $170,212 | $30,000 | $140,212 |
| 2018 | $2,445 | $157,294 | $20,000 | $137,294 |
| 2017 | $2,125 | $142,784 | $0 | $0 |
| 2016 | $2,012 | $133,902 | $0 | $0 |
Source: Public Records
Map
Nearby Homes
- 4907 21st Way E
- 2003 51st Ave E
- 1622 51st Ave E
- 302 51st Ave E
- 4922 18th St E
- 5128 18th Ln E
- 5311 24th Street Ct E
- 5223 17th Street Ct E
- 5105 15th Street Ct E
- 4922 29th Ln E
- 5409 18th Street Blvd E
- 4470 30th St E
- 5207 15th Street Ct E
- 4236 Miller Pointe Ct
- 4232 Miller Pointe Ct
- 4228 Miller Pointe Ct
- 4224 Miller Pointe Ct
- 4220 Miller Pointe Ct
- 4216 Miller Pointe Ct
- 4212 Miller Pointe Ct
Your Personal Tour Guide
Ask me questions while you tour the home.