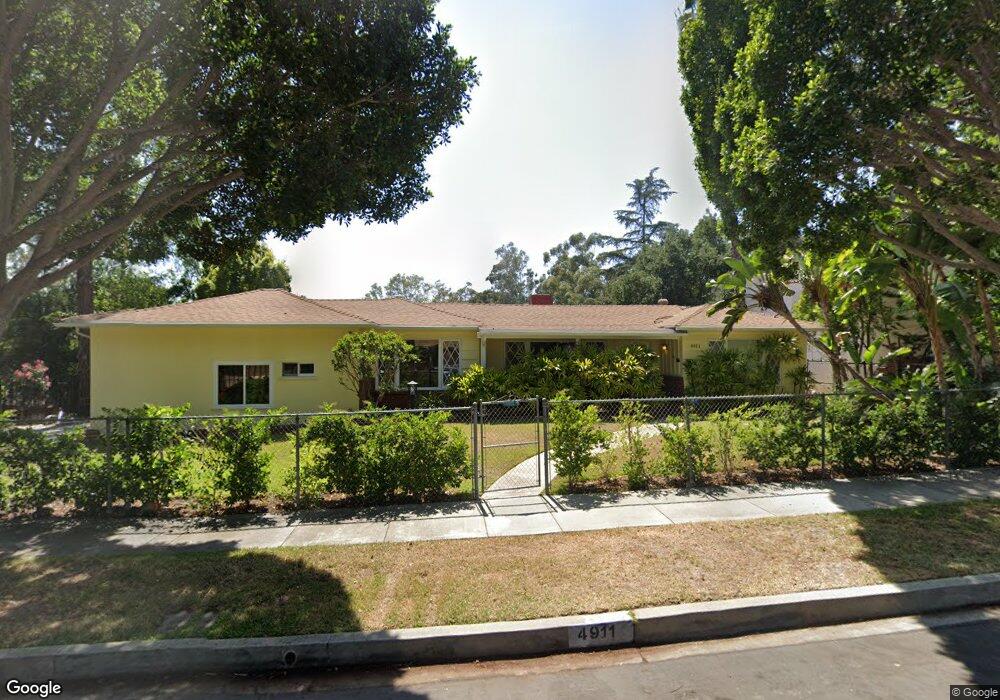
4911 Neola Place Los Angeles, CA 90041
Eagle Rock NeighborhoodEstimated Value: $1,168,000 - $1,706,000
2
Beds
1
Bath
1,464
Sq Ft
$951/Sq Ft
Est. Value
About This Home
This home is located at 4911 Neola Place, Los Angeles, CA 90041 and is currently estimated at $1,392,611, approximately $951 per square foot. 4911 Neola Place is a home located in Los Angeles County with nearby schools including Rockdale Elementary School, Eagle Rock High School, and PUC CALS Middle School and Early College High.
Ownership History
Date
Name
Owned For
Owner Type
Purchase Details
Closed on
Jun 4, 2008
Sold by
Lupo Frank
Bought by
Marquis John and Marquis Charity
Current Estimated Value
Home Financials for this Owner
Home Financials are based on the most recent Mortgage that was taken out on this home.
Original Mortgage
$417,000
Outstanding Balance
$266,765
Interest Rate
5.99%
Mortgage Type
Purchase Money Mortgage
Estimated Equity
$1,125,846
Purchase Details
Closed on
Oct 16, 2001
Sold by
Rundle Donovan and Mcclure Jeneth L
Bought by
Lupo Frank
Home Financials for this Owner
Home Financials are based on the most recent Mortgage that was taken out on this home.
Original Mortgage
$266,000
Interest Rate
8.25%
Purchase Details
Closed on
Aug 2, 1994
Sold by
Barragan Salvador and Barragan Maria Luisa
Bought by
Rundle W Donovan and Mcclure Jeneth L
Home Financials for this Owner
Home Financials are based on the most recent Mortgage that was taken out on this home.
Original Mortgage
$136,000
Interest Rate
8.8%
Create a Home Valuation Report for This Property
The Home Valuation Report is an in-depth analysis detailing your home's value as well as a comparison with similar homes in the area
Home Values in the Area
Average Home Value in this Area
Purchase History
| Date | Buyer | Sale Price | Title Company |
|---|---|---|---|
| Marquis John | $539,000 | Equity Title Los Angeles | |
| Lupo Frank | $332,500 | Equity Title | |
| Rundle W Donovan | $170,000 | Old Republic Title |
Source: Public Records
Mortgage History
| Date | Status | Borrower | Loan Amount |
|---|---|---|---|
| Open | Marquis John | $417,000 | |
| Previous Owner | Lupo Frank | $266,000 | |
| Previous Owner | Rundle W Donovan | $136,000 |
Source: Public Records
Tax History Compared to Growth
Tax History
| Year | Tax Paid | Tax Assessment Tax Assessment Total Assessment is a certain percentage of the fair market value that is determined by local assessors to be the total taxable value of land and additions on the property. | Land | Improvement |
|---|---|---|---|---|
| 2025 | $9,642 | $801,709 | $555,019 | $246,690 |
| 2024 | $9,642 | $785,990 | $544,137 | $241,853 |
| 2023 | $9,455 | $770,579 | $533,468 | $237,111 |
| 2022 | $9,014 | $755,470 | $523,008 | $232,462 |
| 2021 | $8,898 | $740,657 | $512,753 | $227,904 |
| 2019 | $8,630 | $718,692 | $497,546 | $221,146 |
| 2018 | $8,568 | $704,601 | $487,791 | $216,810 |
| 2016 | $7,079 | $586,332 | $468,850 | $117,482 |
| 2015 | $6,975 | $577,526 | $461,808 | $115,718 |
| 2014 | $7,002 | $566,214 | $452,762 | $113,452 |
Source: Public Records
Map
Nearby Homes
- 1325 Linda Rosa Ave
- 1440 Holbrook St
- 4879 Hartwick St
- 1200 Saginaw St
- 4764 Wiota St
- 4890 Floristan Ave
- 0 Wildwood Dr Unit PF25124260
- 5130 Loleta Ave
- 1515 Colorado Blvd
- 1026 Oak Grove Dr
- 1491 Oak Grove Dr
- 1359 Wildwood Dr
- 972 Rockdale Ave
- 1591 Yosemite Dr
- 4984 Vincent Ave
- 5031 Townsend Ave
- 4631 4637 Loleta Place
- 4841 Minden Place
- 1059 Glen Arbor Ave
- 4989 Vincent Ave
- 4866 Wicopee St
- 4870 Wicopee St
- 4883 Neola Place
- 4860 Wicopee St
- 4860 Wicopee Ave
- 4921 Neola Place
- 4854 Wicopee St
- 4873 Neola Place
- 4927 Neola Place
- 4916 Neola Place
- 4912 Neola Place
- 4908 Neola Place
- 4904 Neola Place
- 4920 Neola Place
- 4867 Wicopee Ave
- 4850 Wicopee St
- 4900 Neola Place
- 4924 Neola Place
- 4869 Neola Place
- 4875 Wicopee Ave