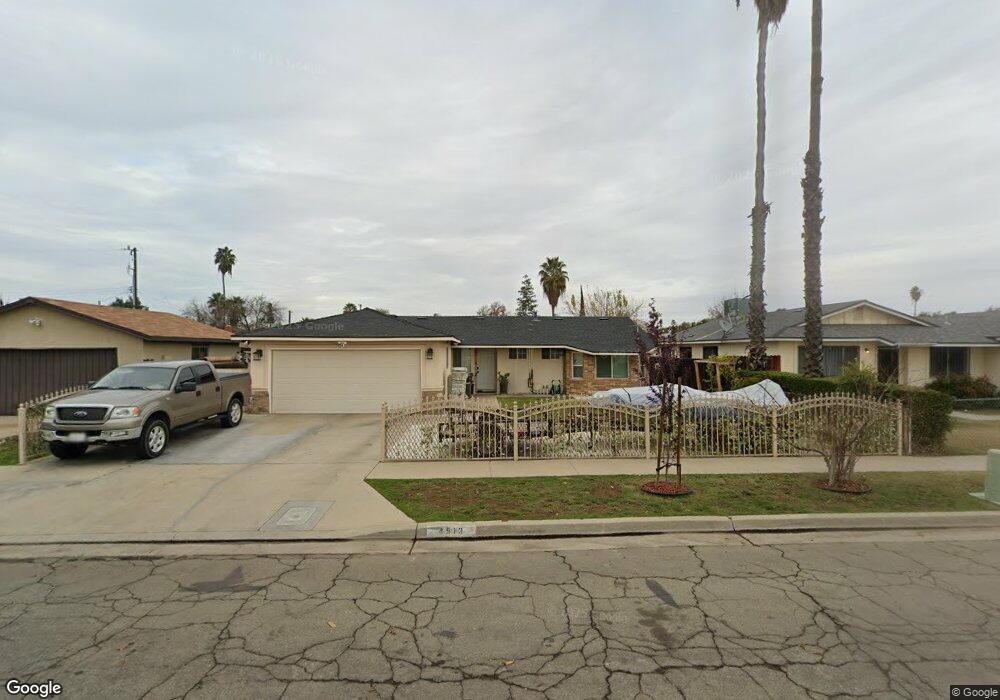
4913 E Huntington Ave Fresno, CA 93727
Sunnyside NeighborhoodEstimated Value: $253,000 - $326,000
3
Beds
2
Baths
1,016
Sq Ft
$282/Sq Ft
Est. Value
About This Home
This home is located at 4913 E Huntington Ave, Fresno, CA 93727 and is currently estimated at $286,982, approximately $282 per square foot. 4913 E Huntington Ave is a home located in Fresno County with nearby schools including David L. Greenberg Elementary School, Kings Canyon Middle School, and Sunnyside High School.
Ownership History
Date
Name
Owned For
Owner Type
Purchase Details
Closed on
Apr 16, 2009
Sold by
Federal National Mortgage Association
Bought by
Nauk Knour
Current Estimated Value
Home Financials for this Owner
Home Financials are based on the most recent Mortgage that was taken out on this home.
Original Mortgage
$73,641
Interest Rate
4.78%
Mortgage Type
FHA
Purchase Details
Closed on
Aug 13, 2008
Sold by
Villeraldo Samuel
Bought by
Federal National Mortgage Association
Purchase Details
Closed on
Jan 4, 1994
Sold by
Mogan Kathaleen M
Bought by
Villeraldo Samuel
Home Financials for this Owner
Home Financials are based on the most recent Mortgage that was taken out on this home.
Original Mortgage
$62,521
Interest Rate
7.19%
Mortgage Type
FHA
Create a Home Valuation Report for This Property
The Home Valuation Report is an in-depth analysis detailing your home's value as well as a comparison with similar homes in the area
Home Values in the Area
Average Home Value in this Area
Purchase History
| Date | Buyer | Sale Price | Title Company |
|---|---|---|---|
| Nauk Knour | $75,000 | Fidelity Natl Title Co Of Ca | |
| Federal National Mortgage Association | $179,523 | Landsafe Title | |
| Villeraldo Samuel | $62,000 | Stewart Title Of Fresno Coun |
Source: Public Records
Mortgage History
| Date | Status | Borrower | Loan Amount |
|---|---|---|---|
| Previous Owner | Nauk Knour | $73,641 | |
| Previous Owner | Villeraldo Samuel | $62,521 |
Source: Public Records
Tax History Compared to Growth
Tax History
| Year | Tax Paid | Tax Assessment Tax Assessment Total Assessment is a certain percentage of the fair market value that is determined by local assessors to be the total taxable value of land and additions on the property. | Land | Improvement |
|---|---|---|---|---|
| 2025 | $1,137 | $96,568 | $45,065 | $51,503 |
| 2023 | $1,114 | $92,820 | $43,316 | $49,504 |
| 2022 | $1,097 | $91,001 | $42,467 | $48,534 |
| 2021 | $1,066 | $89,218 | $41,635 | $47,583 |
| 2020 | $1,060 | $88,305 | $41,209 | $47,096 |
| 2019 | $1,018 | $86,574 | $40,401 | $46,173 |
| 2018 | $995 | $84,877 | $39,609 | $45,268 |
| 2017 | $976 | $83,214 | $38,833 | $44,381 |
| 2016 | $943 | $81,583 | $38,072 | $43,511 |
| 2015 | $927 | $80,359 | $37,501 | $42,858 |
| 2014 | $906 | $78,786 | $36,767 | $42,019 |
Source: Public Records
Map
Nearby Homes
- 4918 E Illinois Ave
- 225 S Dearing Ave
- 4752 E Kerckhoff Ave
- 4749 E Montecito Ave
- 5023 E Lane Ave
- 4923 E Grant Ave
- 408 S Woodrow Ave
- 1190 S Winery Ave Unit 284
- 4983 E Grant Ave
- 5160 E Balch Ave
- 429 S Backer Ave
- 1151 S Chestnut Ave Unit 237
- 1151 S Chestnut Ave Unit 127
- 1151 S Chestnut Ave Unit 215
- 1151 S Chestnut Ave Unit 108
- 419 S Backer Ave
- 4975 E Butler Ave Unit 131
- 5145 E Lane Ave Unit 252
- 4871 E Butler Ave Unit 102
- 421 S Maple Ave
- 4917 E Huntington Ave
- 4909 E Huntington Ave
- 4910 E Laurel Ave
- 4906 E Laurel Ave
- 4914 E Laurel Ave
- 4921 E Huntington Ave
- 4918 E Laurel Ave
- 4902 E Laurel Ave
- 4925 E Huntington Ave
- 4895 E Huntington Ave
- 4922 E Laurel Ave
- 4894 E Laurel Ave
- 4929 E Huntington Ave
- 357 S Winery Ave
- 4926 E Laurel Ave
- 4911 E Laurel Ave
- 341 S Winery Ave
- 4915 E Laurel Ave
- 4907 E Laurel Ave
- 4919 E Laurel Ave