
Highlights
- Yard
- Walking/Biking Trails
- Balcony
- Property Manager on Site
- Views
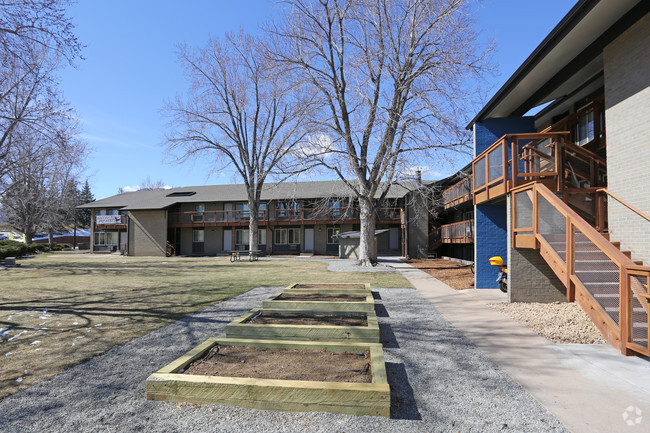
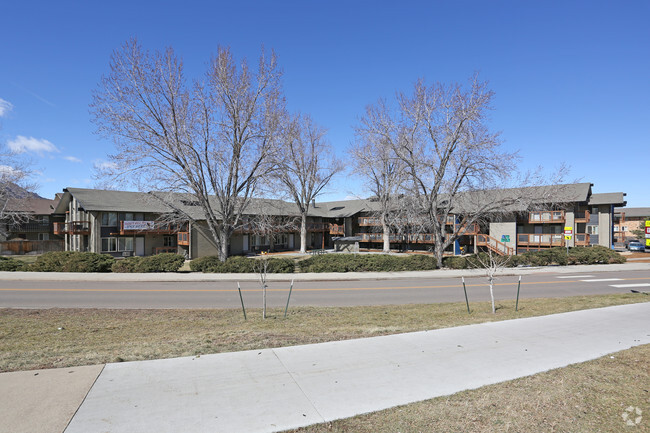
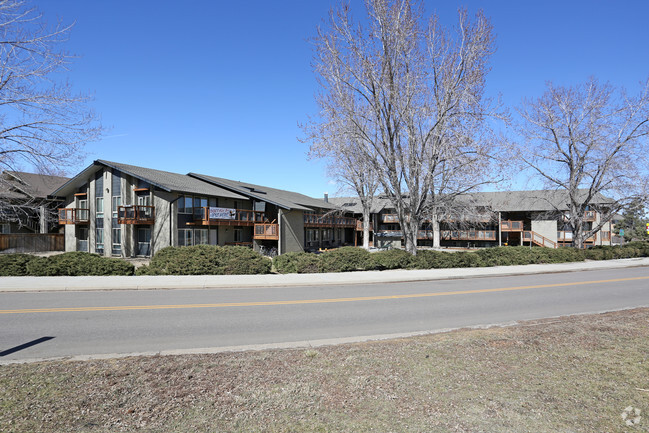
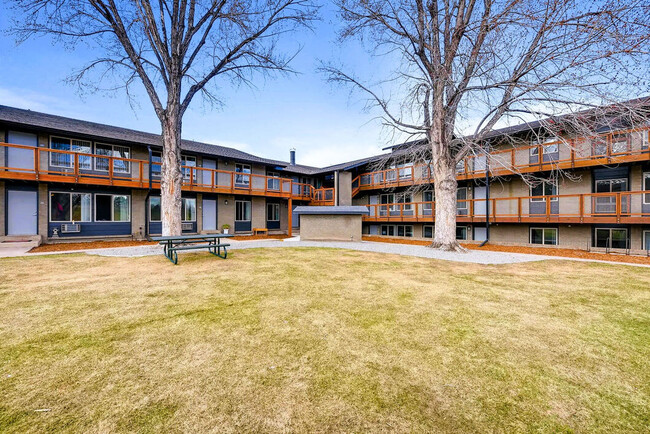
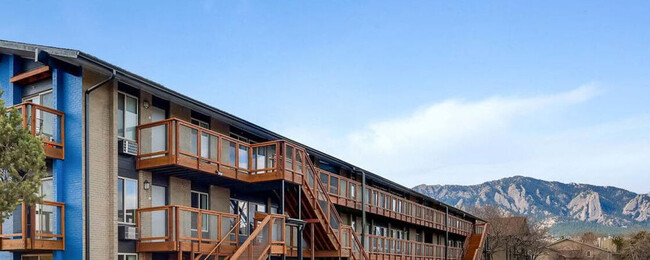
About Nest on Thunderbird
Discover the pinnacle of South Boulder living at Nest on Thunderbird. Our prime location provides easy access to Foothills Parkway, US 36, and the bustling Denver area. Enjoy a leisurely stroll to Table Mesa Park or embark on a scenic bike ride along the nearby paths, immersing yourself in Boulder's natural beauty. With our convenient setting, you'll experience a harmonious blend of urban conveniences and boundless opportunities for outdoor adventures.
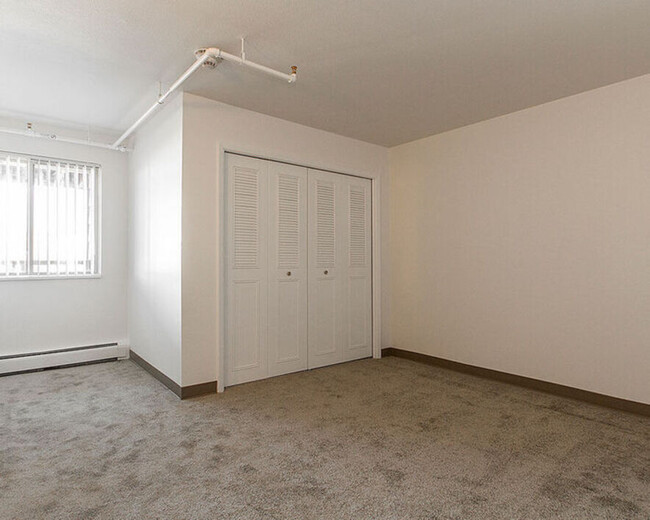
At Nest on Thunderbird, we focus on your needs to find you the perfect space. Our one -, two-, and three-bedroom apartment homes are thoughtfully designed with features that include espresso stained cabinetry and a modern kitchen appliance package.
Schedule a tour today and let us help you find your ideal home!

Pricing and Floor Plans
1 Bedroom
1 Bedroom 1 Bathroom
$1,300 Plus Fees
1 Bed, 1 Bath, 600 Sq Ft
$500 deposit
https://imagescdn.homes.com/i2/fzKhwyRgxVykW_sSJoBLC_9pn6WAlufYXDH8jBjS-44/116/nest-on-thunderbird-boulder-co.jpg?p=1
| Unit | Price | Sq Ft | Availability |
|---|---|---|---|
| -- | $1,300 | 600 | Now |
2 Bedrooms
2 Bedroom 1 Bathroom
$1,448 Plus Fees
2 Beds, 1 Bath, 700 Sq Ft
$500 deposit
https://imagescdn.homes.com/i2/VoSK3vWRzP7PKZzDGr8d67yhuY2M2MahwkmgZG509J0/116/nest-on-thunderbird-boulder-co-3.jpg?p=1
| Unit | Price | Sq Ft | Availability |
|---|---|---|---|
| -- | $1,448 | 700 | Now |
2 Bedroom 1 Bathroom
$1,448 Plus Fees
2 Beds, 1 Bath, 849 Sq Ft
$500 deposit
https://imagescdn.homes.com/i2/DaCLXF8waRhRMpO10BuZ7SAT09v-bT33Kqa-cNxd1E0/116/nest-on-thunderbird-boulder-co-2.jpg?p=1
| Unit | Price | Sq Ft | Availability |
|---|---|---|---|
| -- | $1,448 | 849 | Now |
Fees and Policies
The fees below are based on community-supplied data and may exclude additional fees and utilities.One-Time Basics
Due at Move InPets
Property Fee Disclaimer: Standard Security Deposit subject to change based on screening results; total security deposit(s) will not exceed any legal maximum. Resident may be responsible for maintaining insurance pursuant to the Lease. Some fees may not apply to apartment homes subject to an affordable program. Resident is responsible for damages that exceed ordinary wear and tear. Some items may be taxed under applicable law. This form does not modify the lease. Additional fees may apply in specific situations as detailed in the application and/or lease agreement, which can be requested prior to the application process. All fees are subject to the terms of the application and/or lease. Residents may be responsible for activating and maintaining utility services, including but not limited to electricity, water, gas, and internet, as specified in the lease agreement.
Community Amenities
Property Services
- Laundry Facilities
- Property Manager on Site
Shared Community
- Walk-Up
Fitness & Recreation
- Walking/Biking Trails
Outdoor Features
- Courtyard
Additional Amenities
- Air Conditioning In Select Units
Apartment Features
Indoor Features
- Air Conditioning
- High Speed Internet Access
- Tub/Shower
Kitchen Features & Appliances
- Dishwasher
- Kitchen
- Range
Model Details
- Views
- Carpet
- Vinyl Flooring
- Balcony
- Yard
Map
- 4800 Osage Dr Unit B-16
- 130 Cherokee Way
- 167 Cherokee Way
- 20 S Boulder Cir Unit 20-2204
- 33 S Boulder Cir Unit 316
- 15 Pawnee Dr
- 40 S Boulder Cir Unit 4034
- 30 S Boulder Cir Unit 3018
- 4835 Moorhead Ave
- 230 Pawnee Dr
- 4521 Navajo Place
- 4595 Moorhead Ave
- 4763 Tantra Dr Unit B
- 750 W Moorhead Cir Unit A
- 755 W Moorhead Cir Unit B
- 800 W Moorhead Cir Unit E
- 860 W Moorhead Cir Unit 1I
- 860 W Moorhead Cir Unit 2H
- 74 Huron Ct
- 135 S 42nd St
- 4920 Thunderbird Cir
- 4990 Osage Dr
- 20 S Boulder Cir Unit 2212
- 4977 Moorhead Ave
- 40 S Boulder Cir Unit 4021
- 4678 Ingram Ct
- 4500 Laguna Place
- 645 Manhattan Place Unit 102
- 4475 Laguna Place Unit 212
- 635 Mohawk Dr
- 4500 Baseline Rd Unit 4306
- 640-680 S Lashley Ln
- 652 Inca Pkwy
- 700 Mohawk Dr
- 704-710 Mohawk Dr
- 1417 Bradley Dr
- 3455 Table Mesa Dr
- 760 33rd St
- 880 35th St
- 875 34th St
Ask me questions while you tour the home.