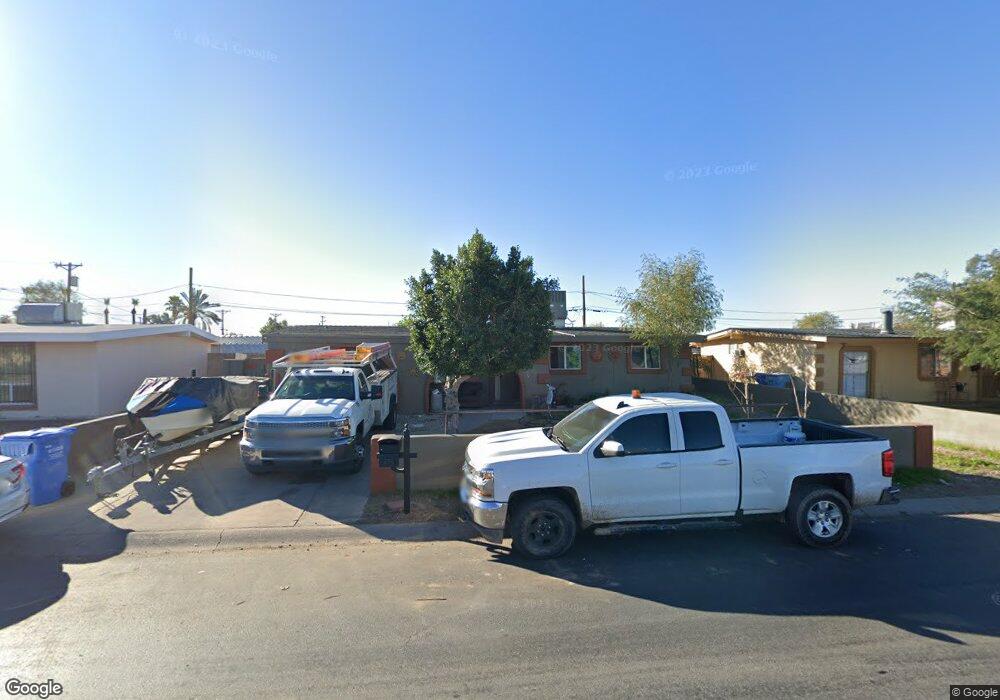
4919 W Pierson St Phoenix, AZ 85031
Maryvale NeighborhoodEstimated Value: $263,000 - $315,000
2
Beds
1
Bath
1,326
Sq Ft
$214/Sq Ft
Est. Value
About This Home
This home is located at 4919 W Pierson St, Phoenix, AZ 85031 and is currently estimated at $283,717, approximately $213 per square foot. 4919 W Pierson St is a home located in Maricopa County with nearby schools including James W. Rice Primary School, Alhambra High School, and Phoenix Coding Academy.
Ownership History
Date
Name
Owned For
Owner Type
Purchase Details
Closed on
Jan 11, 2018
Sold by
Redstone Properties Llc
Bought by
Redstone Properties Seven Llc
Current Estimated Value
Purchase Details
Closed on
Jun 8, 2017
Sold by
Blackstone Development Group Inc
Bought by
Redstone Properties Llc
Purchase Details
Closed on
Mar 4, 2009
Sold by
Hsbc Bank Usa Na
Bought by
Blackstone Development Group Inc
Purchase Details
Closed on
Jan 12, 2009
Sold by
Arce Jose E
Bought by
Hsbc Bank Usa Na
Purchase Details
Closed on
Aug 8, 2005
Sold by
Chairez Armando
Bought by
Arce Jose E
Home Financials for this Owner
Home Financials are based on the most recent Mortgage that was taken out on this home.
Original Mortgage
$122,720
Interest Rate
6%
Mortgage Type
Fannie Mae Freddie Mac
Purchase Details
Closed on
Jun 24, 1997
Sold by
Radcliffe Richard W and Radcliffe Linda S
Bought by
Chairez Armando
Home Financials for this Owner
Home Financials are based on the most recent Mortgage that was taken out on this home.
Original Mortgage
$62,883
Interest Rate
7.92%
Mortgage Type
FHA
Create a Home Valuation Report for This Property
The Home Valuation Report is an in-depth analysis detailing your home's value as well as a comparison with similar homes in the area
Home Values in the Area
Average Home Value in this Area
Purchase History
| Date | Buyer | Sale Price | Title Company |
|---|---|---|---|
| Redstone Properties Seven Llc | -- | None Available | |
| Redstone Properties Llc | -- | None Available | |
| Blackstone Development Group Inc | $27,500 | Guaranty Title Agency | |
| Hsbc Bank Usa Na | $69,750 | None Available | |
| Arce Jose E | $153,400 | Camelback Title Agency Llc | |
| Chairez Armando | $62,900 | Ati Title Agency |
Source: Public Records
Mortgage History
| Date | Status | Borrower | Loan Amount |
|---|---|---|---|
| Previous Owner | Arce Jose E | $122,720 | |
| Previous Owner | Chairez Armando | $62,883 |
Source: Public Records
Tax History Compared to Growth
Tax History
| Year | Tax Paid | Tax Assessment Tax Assessment Total Assessment is a certain percentage of the fair market value that is determined by local assessors to be the total taxable value of land and additions on the property. | Land | Improvement |
|---|---|---|---|---|
| 2025 | $773 | $4,892 | -- | -- |
| 2024 | $706 | $4,659 | -- | -- |
| 2023 | $706 | $21,820 | $4,360 | $17,460 |
| 2022 | $695 | $16,830 | $3,360 | $13,470 |
| 2021 | $702 | $14,150 | $2,830 | $11,320 |
| 2020 | $675 | $12,910 | $2,580 | $10,330 |
| 2019 | $666 | $10,810 | $2,160 | $8,650 |
| 2018 | $615 | $9,900 | $1,980 | $7,920 |
| 2017 | $607 | $7,610 | $1,520 | $6,090 |
| 2016 | $582 | $6,670 | $1,330 | $5,340 |
| 2015 | $551 | $5,450 | $1,090 | $4,360 |
Source: Public Records
Map
Nearby Homes
- 4948 W Pierson St Unit 2B
- 4727 N 50th Dr
- 4715 N 51st Ave
- 4612 N 50th Dr
- 5201 W Camelback Rd Unit Lot D-82
- 5201 W Camelback Rd Unit site f295
- 5201 W Camelback Rd Unit 238
- 5201 W Camelback Rd
- 5201 W Camelback Rd Unit FC198
- 5201 W Camelback Rd Unit f210
- 5201 W Camelback Rd Unit site a027
- 5201 W Camelback Rd Unit site f130
- 5201 W Camelback Rd Unit site f210
- 5201 W Camelback Rd Unit e146
- 5201 W Camelback Rd Unit site h227
- 5201 W Camelback Rd Unit site b054
- 5201 W Camelback Rd Unit site c107
- 5201 W Camelback Rd Unit A187
- 5201 W Camelback Rd Unit site f195
- 4602 N 47th Ave
- 4923 W Pierson St
- 4911 W Pierson St
- 4920 W Elm St
- 4929 W Pierson St
- 4924 W Elm St
- 4916 W Elm St
- 4918 W Pierson St
- 4744 N 49th Ave Unit 2B
- 4922 W Pierson St
- 4912 W Pierson St
- 4930 W Elm St
- 4734 N 49th Ave Unit 2B
- 4935 W Pierson St
- 4928 W Pierson St
- 4908 W Pierson St
- 4726 N 49th Ave
- 4936 W Elm St
- 4932 W Pierson St
- 4902 W Pierson St
- 4915 W Elm St