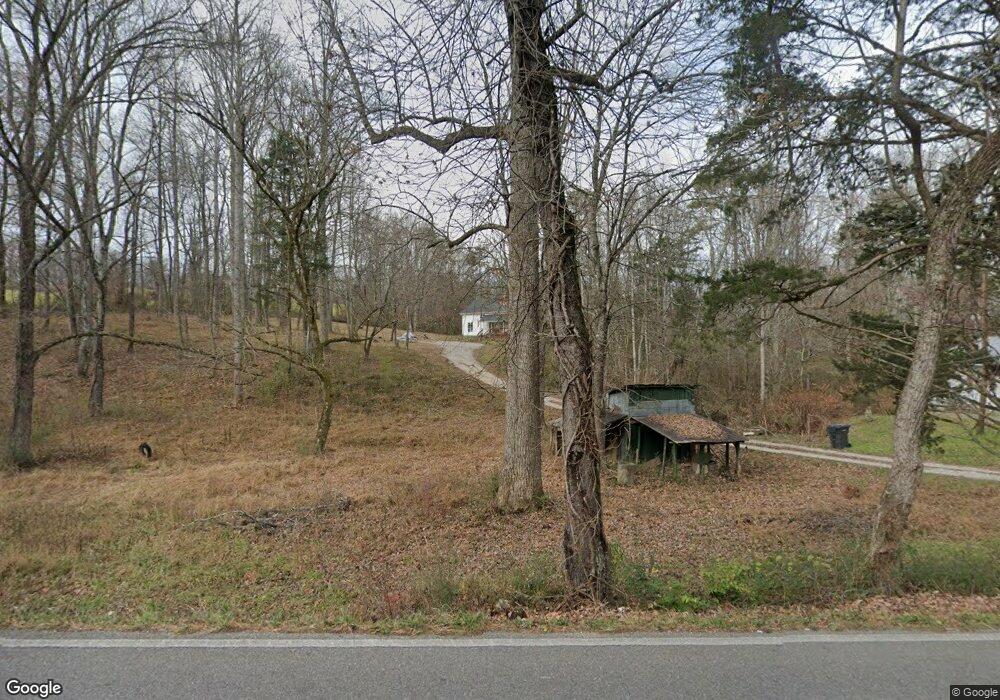
492 Pinecrest Rd Jacksboro, TN 37757
Estimated Value: $281,000 - $362,731
4
Beds
3
Baths
2,292
Sq Ft
$136/Sq Ft
Est. Value
About This Home
This home is located at 492 Pinecrest Rd, Jacksboro, TN 37757 and is currently estimated at $312,433, approximately $136 per square foot. 492 Pinecrest Rd is a home located in Campbell County with nearby schools including Calvary Christian Academy.
Ownership History
Date
Name
Owned For
Owner Type
Purchase Details
Closed on
Nov 4, 2011
Sold by
Vibbert Gregg
Bought by
Stooksbury Robert G
Current Estimated Value
Home Financials for this Owner
Home Financials are based on the most recent Mortgage that was taken out on this home.
Original Mortgage
$94,897
Outstanding Balance
$64,711
Interest Rate
4.02%
Mortgage Type
Commercial
Estimated Equity
$247,722
Purchase Details
Closed on
May 20, 2011
Bought by
Vibbert Gregg Nancy
Purchase Details
Closed on
May 6, 2011
Bought by
Vibbert Greg Nancy
Purchase Details
Closed on
Sep 23, 1996
Bought by
Lawson Clureta Mae
Purchase Details
Closed on
Aug 1, 1995
Bought by
Lawson Ben P
Purchase Details
Closed on
Jan 5, 1989
Bought by
Lawson Ray
Purchase Details
Closed on
Mar 26, 1985
Bought by
Lawson Ray
Purchase Details
Closed on
Nov 19, 1981
Bought by
Lawson Ben
Create a Home Valuation Report for This Property
The Home Valuation Report is an in-depth analysis detailing your home's value as well as a comparison with similar homes in the area
Home Values in the Area
Average Home Value in this Area
Purchase History
| Date | Buyer | Sale Price | Title Company |
|---|---|---|---|
| Stooksbury Robert G | $93,000 | -- | |
| Vibbert Gregg Nancy | -- | -- | |
| Vibbert Greg Nancy | -- | -- | |
| Lawson Clureta Mae | $4,000 | -- | |
| Lawson Ben P | $5,100 | -- | |
| Lawson Ray | $200 | -- | |
| Lawson Ray | -- | -- | |
| Lawson Ben | -- | -- |
Source: Public Records
Mortgage History
| Date | Status | Borrower | Loan Amount |
|---|---|---|---|
| Open | Stooksbury Robert G | $94,897 |
Source: Public Records
Tax History
| Year | Tax Paid | Tax Assessment Tax Assessment Total Assessment is a certain percentage of the fair market value that is determined by local assessors to be the total taxable value of land and additions on the property. | Land | Improvement |
|---|---|---|---|---|
| 2025 | $748 | $61,550 | $16,175 | $45,375 |
| 2024 | $748 | $61,550 | $16,175 | $45,375 |
| 2023 | $713 | $34,525 | $11,700 | $22,825 |
| 2022 | $713 | $34,525 | $11,700 | $22,825 |
| 2021 | $713 | $34,525 | $11,700 | $22,825 |
| 2020 | $699 | $34,525 | $11,700 | $22,825 |
| 2019 | $713 | $34,525 | $11,700 | $22,825 |
| 2018 | $632 | $28,100 | $7,175 | $20,925 |
| 2017 | $632 | $28,100 | $7,175 | $20,925 |
| 2016 | $632 | $28,100 | $7,175 | $20,925 |
| 2015 | $559 | $28,100 | $7,175 | $20,925 |
| 2014 | -- | $28,100 | $7,175 | $20,925 |
| 2013 | -- | $28,100 | $7,175 | $20,925 |
Source: Public Records
Map
Nearby Homes
- 0 McGhee Ln Unit 1323543
- 129 Austin Ln
- 310 Hollifield Dr
- 111 Azalea Ln Unit 2
- 107 Azalea Ln Unit 1
- 267 Far View Cir
- 107 River Rd
- 451 Hollifield Dr
- 328 Mount Paran Rd
- 111 Rockwaller Ln
- 136 Log Ln
- 117 Bertha Ln
- 0 River Rd
- 844 Mount Paran Rd
- 205 Hickory Ln
- 109 Cherry Ln
- 1327 Pinecrest Rd
- 0 Dogwood Ln
- 114 Myrtle Vinsant Ln
- 459 Dogwood Ln
- 488 Pinecrest Rd
- 495 Pinecrest Rd
- 439 Pinecrest Rd
- 523 Pinecrest Rd
- 467 Pinecrest Rd
- 422 Pinecrest Rd
- 412 Pinecrest Rd
- 412 Pinecrest Rd
- 546 Pinecrest Rd
- 437 Pinecrest Rd
- 411 Pinecrest Rd
- 459 Pinecrest Rd
- 451 Pinecrest Rd
- 382 Pinecrest Rd
- 567 Pinecrest Rd
- 576 Pinecrest Rd
- 530 Pinecrest Rd
- 386 Vinsant Estates Rd
- 397 Pinecrest Rd
- 371 Pinecrest Rd
Your Personal Tour Guide
Ask me questions while you tour the home.