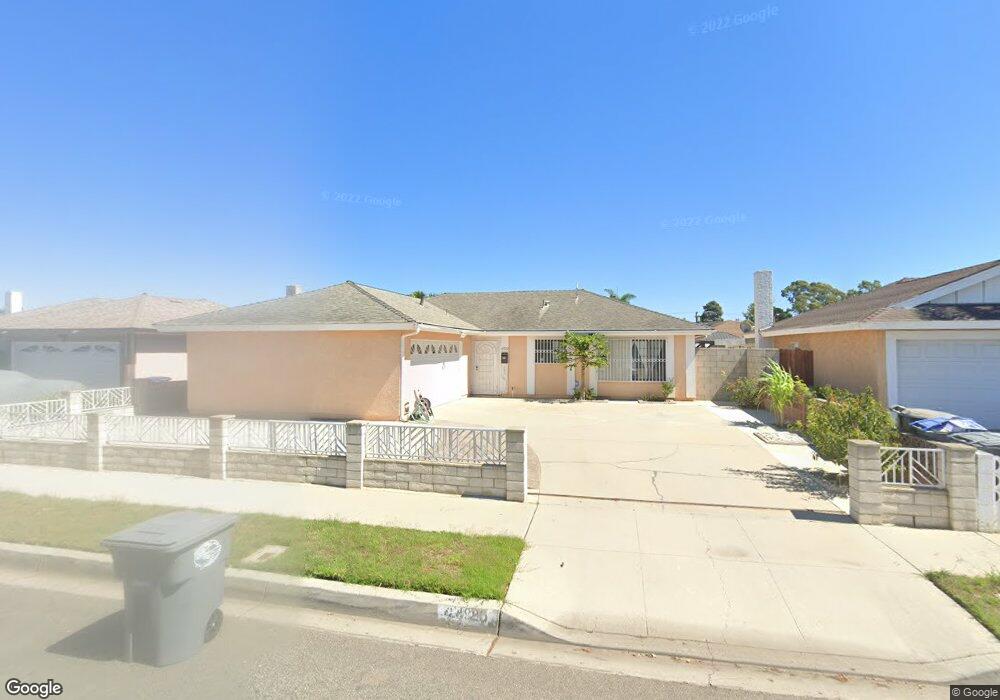
4920 Justin Way Oxnard, CA 93033
Pleasant Valley Estates NeighborhoodEstimated Value: $696,000 - $734,000
3
Beds
2
Baths
1,360
Sq Ft
$524/Sq Ft
Est. Value
About This Home
This home is located at 4920 Justin Way, Oxnard, CA 93033 and is currently estimated at $712,470, approximately $523 per square foot. 4920 Justin Way is a home located in Ventura County with nearby schools including Julien Hathaway Elementary School and Channel Islands High School.
Ownership History
Date
Name
Owned For
Owner Type
Purchase Details
Closed on
Oct 6, 2004
Sold by
Elizarraraz Jaime and Torrez Salvador A
Bought by
Torres Salvador A
Current Estimated Value
Home Financials for this Owner
Home Financials are based on the most recent Mortgage that was taken out on this home.
Original Mortgage
$343,000
Interest Rate
5.65%
Mortgage Type
Purchase Money Mortgage
Purchase Details
Closed on
Jun 3, 2003
Sold by
Araujo Jose E and Araujo Lilia
Bought by
Elizarraraz Jaime and Torres Salvador A
Home Financials for this Owner
Home Financials are based on the most recent Mortgage that was taken out on this home.
Original Mortgage
$262,400
Interest Rate
5.99%
Mortgage Type
Purchase Money Mortgage
Purchase Details
Closed on
Apr 18, 2002
Sold by
Tan Jose E and Tan Delane L
Bought by
Araujo Jose E and Araujo Lilia
Home Financials for this Owner
Home Financials are based on the most recent Mortgage that was taken out on this home.
Original Mortgage
$248,400
Interest Rate
6.86%
Create a Home Valuation Report for This Property
The Home Valuation Report is an in-depth analysis detailing your home's value as well as a comparison with similar homes in the area
Home Values in the Area
Average Home Value in this Area
Purchase History
| Date | Buyer | Sale Price | Title Company |
|---|---|---|---|
| Torres Salvador A | $171,500 | Ticor Title Company | |
| Elizarraraz Jaime | $328,000 | Chicago Title | |
| Araujo Jose E | $276,000 | Fidelity National Title Co |
Source: Public Records
Mortgage History
| Date | Status | Borrower | Loan Amount |
|---|---|---|---|
| Previous Owner | Torres Salvador A | $343,000 | |
| Previous Owner | Elizarraraz Jaime | $262,400 | |
| Previous Owner | Araujo Jose E | $248,400 | |
| Closed | Elizarraraz Jaime | $65,600 |
Source: Public Records
Tax History
| Year | Tax Paid | Tax Assessment Tax Assessment Total Assessment is a certain percentage of the fair market value that is determined by local assessors to be the total taxable value of land and additions on the property. | Land | Improvement |
|---|---|---|---|---|
| 2025 | $5,592 | $475,030 | $237,516 | $237,514 |
| 2024 | $5,592 | $465,716 | $232,859 | $232,857 |
| 2023 | $5,261 | $456,585 | $228,293 | $228,292 |
| 2022 | $5,151 | $447,633 | $223,817 | $223,816 |
| 2021 | $5,214 | $438,856 | $219,428 | $219,428 |
| 2020 | $5,309 | $434,358 | $217,179 | $217,179 |
| 2019 | $5,148 | $425,842 | $212,921 | $212,921 |
| 2018 | $4,957 | $417,494 | $208,747 | $208,747 |
| 2017 | $4,794 | $409,308 | $204,654 | $204,654 |
| 2016 | $4,401 | $387,000 | $194,000 | $193,000 |
| 2015 | $4,016 | $343,000 | $172,000 | $171,000 |
| 2014 | $3,726 | $318,000 | $159,000 | $159,000 |
Source: Public Records
Map
Nearby Homes
- 5117 Jefferson Square
- 5222 Longfellow Way
- 4340 Highland Ave
- 4160 Petit Dr Unit 39
- 5225 Columbus Place
- 320 Columbia Place Unit 46
- 280 Columbia Place Unit 48
- 4200 Browning Dr
- 860 Morro Way
- 360 Ibsen Place Unit 129
- 4200 S A St
- 140 Gaviota Place Unit 157
- 4029 S B St
- 3631 La Costa Place
- 341 Cuesta Del Mar Dr
- 5121 Perkins Rd
- 3638 S B St
- 3151 Fournier St
- 3130 Paula St
- 4032 Mockingbird Ln
- 4930 Justin Way
- 4921 San Juan Ave
- 4911 San Juan Ave
- 4931 San Juan Ave
- 4900 Justin Way
- 5000 Justin Way
- 4901 San Juan Ave
- 5001 San Juan Ave
- 4921 Justin Way
- 4911 Justin Way
- 4931 Justin Way
- 4840 Justin Way
- 5010 Justin Way
- 4901 Justin Way
- 5001 Justin Way
- 4831 San Juan Ave
- 5011 San Juan Ave
- 5020 Justin Way
- 4830 Justin Way
- 5011 Justin Way
Your Personal Tour Guide
Ask me questions while you tour the home.