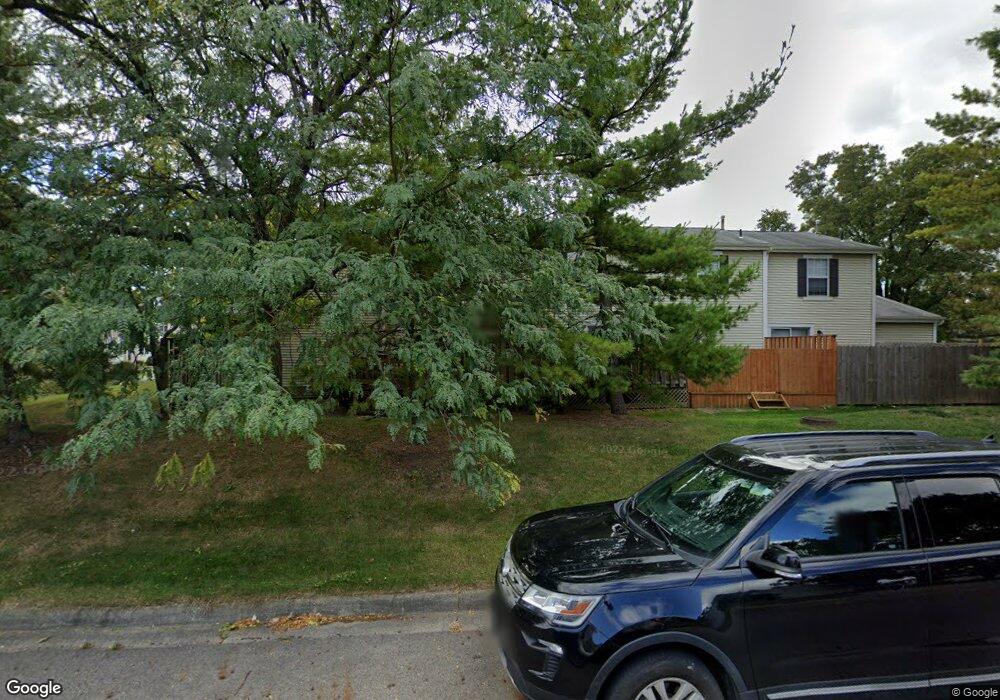
4922 Singleton Dr Unit 6C Hilliard, OH 43026
Cross Creek NeighborhoodEstimated Value: $173,000 - $191,000
About This Home
This home is located at 4922 Singleton Dr Unit 6C, Hilliard, OH 43026 and is currently estimated at $183,644, approximately $220 per square foot. 4922 Singleton Dr Unit 6C is a home located in Franklin County with nearby schools including Hilliard Crossing Elementary School, Hilliard Station Sixth Grade Elementary School, and Hilliard Heritage Middle School.
Ownership History
Purchase Details
Home Financials for this Owner
Home Financials are based on the most recent Mortgage that was taken out on this home.Purchase Details
Home Financials for this Owner
Home Financials are based on the most recent Mortgage that was taken out on this home.Purchase Details
Home Financials for this Owner
Home Financials are based on the most recent Mortgage that was taken out on this home.Purchase Details
Home Values in the Area
Average Home Value in this Area
Purchase History
We collect this data history from publicly available records. To have your information removed, we recommend requesting removal directly through your county’s website.
| Date | Buyer | Sale Price | Title Company |
|---|---|---|---|
| Juniper Alaina M | $83,900 | Transohio | |
| Epley Teresa Marie | $79,000 | Amerititle | |
| Pella Louise C | $58,000 | -- | |
| -- | $52,300 | -- |
Mortgage History
We collect this data history from publicly available records. To have your information removed, we recommend requesting removal directly through your county’s website.
| Date | Status | Borrower | Loan Amount |
|---|---|---|---|
| Open | Juniper Alaina M | $82,585 | |
| Previous Owner | Epley Teresa Marie | $78,378 | |
| Previous Owner | Pella Louise C | $56,650 |
Tax History
| Year | Tax Paid | Tax Assessment Tax Assessment Total Assessment is a certain percentage of the fair market value that is determined by local assessors to be the total taxable value of land and additions on the property. | Land | Improvement |
|---|---|---|---|---|
| 2025 | $2,578 | $45,640 | $9,800 | $35,840 |
| 2024 | $2,578 | $45,640 | $9,800 | $35,840 |
| 2023 | $2,233 | $45,640 | $9,800 | $35,840 |
| 2022 | $2,238 | $36,620 | $4,590 | $32,030 |
| 2021 | $2,235 | $36,620 | $4,590 | $32,030 |
| 2020 | $2,229 | $36,620 | $4,590 | $32,030 |
| 2019 | $1,799 | $25,240 | $3,150 | $22,090 |
| 2018 | $1,655 | $25,240 | $3,150 | $22,090 |
| 2017 | $1,792 | $25,240 | $3,150 | $22,090 |
| 2016 | $1,620 | $21,140 | $3,080 | $18,060 |
| 2015 | $1,519 | $21,140 | $3,080 | $18,060 |
| 2014 | $1,521 | $21,140 | $3,080 | $18,060 |
| 2013 | $856 | $23,485 | $3,430 | $20,055 |
Map
- 4947 Singleton Dr Unit 13D
- 2763 Ciniminson Ct
- 4808 Mattox St Unit 55
- 4843 Stoneybrook Blvd Unit 30E
- 5115 Renmill Dr
- 5138 Roberts Rd
- 5080 Springdale Blvd Unit 31F
- 5080 Stoneybrook Blvd Unit 2D
- 5264 Windflower Ct
- 4920 Meadow Run Dr Unit 4920
- 5321 Redlands Dr
- 3259 Garrison Ct
- 2484 Warm Springs Dr Unit 2484
- 4583 Fern Trail Dr
- 3277 Garrison Ct
- 5070 Gredle Dr
- 5074 Langcroft Dr
- 4519 Addison Ln S
- 4423 Knickel Dr
- 3150 Hilliard Rome Rd
- 4942 Singleton Dr Unit 7C
- 4940 Singleton Dr
- 4940 Singleton Dr Unit 7D
- 4944 Singleton Dr Unit 7B
- 4946 Singleton Dr Unit 7A
- 4926 Singleton Dr Unit 6A
- 4924 Singleton Dr Unit 6B
- 4901 Singleton Dr Unit 9A
- 4903 Singleton Dr
- 4903 Singleton Dr Unit 9B
- 4937 Singleton Dr Unit 11D
- 4920 Singleton Dr
- 4935 Singleton Dr Unit 11C
- 4905 Singleton Dr
- 4933 Singleton Dr Unit 11B
- 4907 Singleton Dr
- 4907 Singleton Dr Unit 9D
- 4922 Ivywild Ave
- 4931 Singleton Dr
- 4930 Ivywild Ave
Ask me questions while you tour the home.