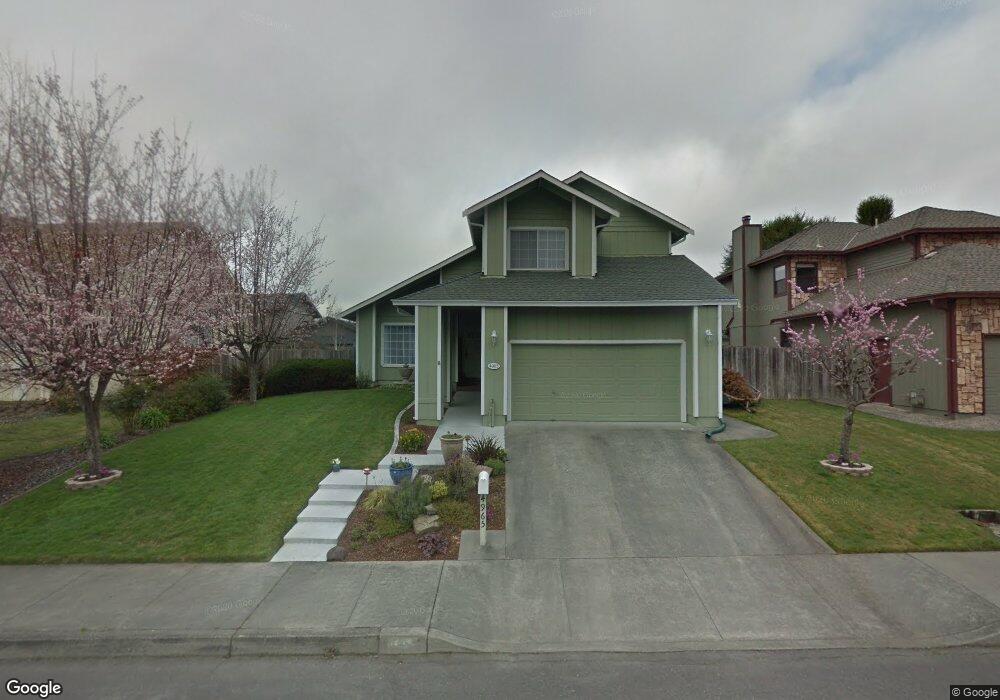
4965 Lundblade Dr Eureka, CA 95503
Estimated Value: $480,490 - $602,000
3
Beds
2
Baths
1,900
Sq Ft
$290/Sq Ft
Est. Value
About This Home
This home is located at 4965 Lundblade Dr, Eureka, CA 95503 and is currently estimated at $550,373, approximately $289 per square foot. 4965 Lundblade Dr is a home located in Humboldt County with nearby schools including Grant Elementary School, Winship Middle School, and Eureka Senior High School.
Ownership History
Date
Name
Owned For
Owner Type
Purchase Details
Closed on
Nov 18, 2009
Sold by
Clark Debra S
Bought by
Mueller Schieberl John and Mueller Schieberl Jessica
Current Estimated Value
Home Financials for this Owner
Home Financials are based on the most recent Mortgage that was taken out on this home.
Original Mortgage
$320,585
Outstanding Balance
$208,041
Interest Rate
4.88%
Mortgage Type
FHA
Estimated Equity
$342,332
Purchase Details
Closed on
Jul 8, 2005
Sold by
Rose Olsen Maureen and Oconnell Family Revocable Trus
Bought by
Clark Debra S
Home Financials for this Owner
Home Financials are based on the most recent Mortgage that was taken out on this home.
Original Mortgage
$315,000
Interest Rate
5.5%
Mortgage Type
Fannie Mae Freddie Mac
Create a Home Valuation Report for This Property
The Home Valuation Report is an in-depth analysis detailing your home's value as well as a comparison with similar homes in the area
Purchase History
| Date | Buyer | Sale Price | Title Company |
|---|---|---|---|
| Mueller Schieberl John | $326,500 | Fidelity Natl Title Co Of Ca | |
| Clark Debra S | $405,000 | First American Title Ins Co |
Source: Public Records
Mortgage History
| Date | Status | Borrower | Loan Amount |
|---|---|---|---|
| Open | Mueller Schieberl John | $320,585 | |
| Previous Owner | Clark Debra S | $315,000 |
Source: Public Records
Tax History
| Year | Tax Paid | Tax Assessment Tax Assessment Total Assessment is a certain percentage of the fair market value that is determined by local assessors to be the total taxable value of land and additions on the property. | Land | Improvement |
|---|---|---|---|---|
| 2025 | $4,261 | $421,440 | $154,892 | $266,548 |
| 2024 | $4,261 | $413,177 | $151,855 | $261,322 |
| 2023 | $4,200 | $405,077 | $148,878 | $256,199 |
| 2022 | $4,358 | $397,135 | $145,959 | $251,176 |
| 2021 | $4,080 | $389,349 | $143,098 | $246,251 |
| 2020 | $4,048 | $385,357 | $141,631 | $243,726 |
| 2019 | $3,964 | $377,802 | $138,854 | $238,948 |
| 2018 | $3,903 | $370,395 | $136,132 | $234,263 |
| 2017 | $3,882 | $363,133 | $133,463 | $229,670 |
| 2016 | $3,881 | $356,014 | $130,847 | $225,167 |
| 2015 | $3,846 | $350,667 | $128,882 | $221,785 |
| 2014 | $3,594 | $343,799 | $126,358 | $217,441 |
Source: Public Records
Map
Nearby Homes
- 4150 E St
- 4843 Meyers Ave
- 4672 Union St
- 5245 Vance Ave
- 3981 F St
- 4483 Excelsior Rd
- 1956 Gage Ln
- 3945 Davis Ct
- 5463 Noe Ave
- 3923 D St
- 5200 Blackberry Ln
- 1651 Rachel Ln
- 1220 Vista Dr
- 0 Brogan Way Unit SR25066460
- 0 Brogan Way Unit 270075
- 700 Sea Ave
- 1599 Fern Dr
- 3657 H St
- 2005 Foxwood Dr
- 4286 Walnut Dr
- 4971 Lundblade Dr
- 4959 Lundblade Dr
- 358 Wells Dr
- 406 Wells Dr
- 348 Wells Dr
- 4977 Lundblade Dr
- 4951 Lundblade Dr
- 416 Wells Dr
- 4966 Lundblade Dr
- 338 Wells Dr
- 4960 Lundblade Dr
- 4974 Lundblade Dr
- 4924 Patricia Dr
- 4945 Lundblade Dr
- 4912 Patricia Dr
- 4980 Lundblade Dr
- 105 Boyle Dr
- 353 Wells Dr
- 4937 Lundblade Dr
- 341 Wells Dr
Your Personal Tour Guide
Ask me questions while you tour the home.