
4970 Twining St Los Angeles, CA 90032
El Sereno Neighborhood
3
Beds
2.5
Baths
1,500
Sq Ft
7,500
Sq Ft Lot
Highlights
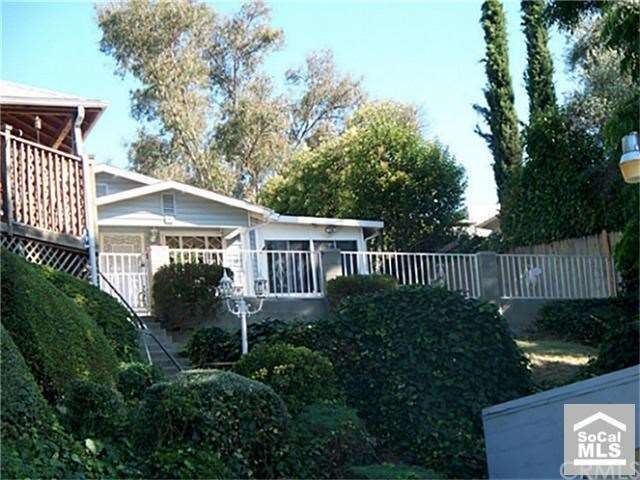
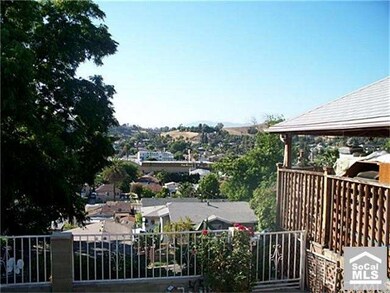
- City Lights View
- Deck
- Patio
- Abraham Lincoln High School Rated A
- Fireplace
- Bungalow
About This Home
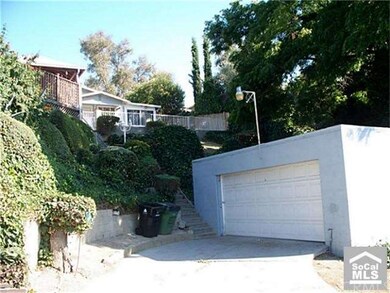
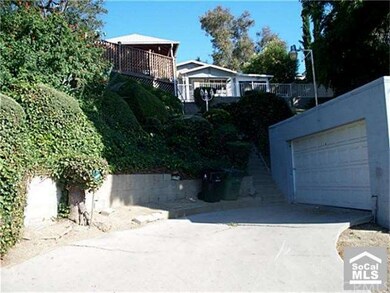
As of October 2014Approved Approved Short Sale Approved as of 12/15/2011 El Sereno view home!!! Great location close to South Pasadena and Alhambra.With a little TLC home will be very nice. Property has two decks with great views, 3 good size bedrooms and 3 baths, sun room and a two car garage.
Last Agent to Sell the Property
Century 21 Allstars License #01028116 Listed on: 07/07/2011
Last Buyer's Agent
Outside Agent
CLAW Reciprocal Listings
Home Details
Home Type
- Single Family
Est. Annual Taxes
- $5,905
Year Built
- Built in 1922
Lot Details
- 7,500 Sq Ft Lot
- Lot Dimensions are 50x150
- Chain Link Fence
Parking
- 2 Car Garage
- Single Garage Door
Property Views
- City Lights
- Mountain
Home Design
- Bungalow
- Shingle Roof
- Composition Roof
- Partial Copper Plumbing
Interior Spaces
- 1,500 Sq Ft Home
- Fireplace
- Dining Room
Kitchen
- Gas Oven or Range
- Range
Bedrooms and Bathrooms
- 3 Bedrooms
Outdoor Features
- Deck
- Patio
Utilities
- Central Heating and Cooling System
- Sewer Paid
Listing and Financial Details
- Tax Lot 65
- Tax Tract Number 3385
- Assessor Parcel Number 5218018005
Ownership History
Date
Name
Owned For
Owner Type
Purchase Details
Closed on
Sep 11, 2017
Sold by
Coletta Jamie L
Bought by
Hernandez Cruz Juan and Coletta Jamie L
Current Estimated Value
Purchase Details
Listed on
Jul 16, 2014
Closed on
Oct 2, 2014
Sold by
Coletta Domenic M
Bought by
Coletta Sandra L
Seller's Agent
Steven Tobin
Modern Realtors Real Estate
Buyer's Agent
Cynthia Guzman
Excellence RE Real Estate
List Price
$399,999
Sold Price
$400,000
Premium/Discount to List
$1
0.0%
Home Financials for this Owner
Home Financials are based on the most recent Mortgage that was taken out on this home.
Avg. Annual Appreciation
8.39%
Original Mortgage
$360,000
Interest Rate
4.08%
Mortgage Type
New Conventional
Purchase Details
Listed on
Jul 16, 2014
Closed on
Oct 1, 2014
Sold by
Zecena Anqie M
Bought by
Coletta Jamie L and Coletta Sandra L
Seller's Agent
Steven Tobin
Modern Realtors Real Estate
Buyer's Agent
Cynthia Guzman
Excellence RE Real Estate
List Price
$399,999
Sold Price
$400,000
Premium/Discount to List
$1
0.0%
Home Financials for this Owner
Home Financials are based on the most recent Mortgage that was taken out on this home.
Original Mortgage
$360,000
Interest Rate
4.08%
Mortgage Type
New Conventional
Purchase Details
Closed on
Feb 21, 2014
Sold by
Flores Richard
Bought by
Zecena Angie M
Home Financials for this Owner
Home Financials are based on the most recent Mortgage that was taken out on this home.
Original Mortgage
$252,450
Interest Rate
4.25%
Mortgage Type
New Conventional
Purchase Details
Closed on
May 6, 2005
Sold by
Flores Richard and Flores Nancy A
Bought by
Flores Richard
Home Financials for this Owner
Home Financials are based on the most recent Mortgage that was taken out on this home.
Original Mortgage
$378,000
Interest Rate
7.1%
Mortgage Type
Fannie Mae Freddie Mac
Purchase Details
Closed on
Oct 30, 2004
Sold by
Flores Richard and Flores Nancy A
Bought by
Flores Richard
Home Financials for this Owner
Home Financials are based on the most recent Mortgage that was taken out on this home.
Original Mortgage
$264,000
Interest Rate
6.99%
Mortgage Type
Unknown
Purchase Details
Closed on
Feb 19, 2003
Sold by
Flores Richard and Flores Nancy
Bought by
Flores Richard
Home Financials for this Owner
Home Financials are based on the most recent Mortgage that was taken out on this home.
Original Mortgage
$129,000
Interest Rate
10.25%
Purchase Details
Closed on
Feb 1, 1993
Sold by
Flores Rosemarie
Bought by
Flores Richard
Similar Home in Los Angeles, CA
Create a Home Valuation Report for This Property
The Home Valuation Report is an in-depth analysis detailing your home's value as well as a comparison with similar homes in the area
Home Values in the Area
Average Home Value in this Area
Purchase History
| Date | Type | Sale Price | Title Company |
|---|---|---|---|
| Interfamily Deed Transfer | -- | None Available | |
| Interfamily Deed Transfer | -- | None Available | |
| Interfamily Deed Transfer | -- | None Available | |
| Grant Deed | $400,000 | None Available | |
| Grant Deed | $297,000 | Provident Title | |
| Interfamily Deed Transfer | -- | -- | |
| Interfamily Deed Transfer | -- | -- | |
| Interfamily Deed Transfer | -- | Fswtc | |
| Interfamily Deed Transfer | -- | -- |
Source: Public Records
Mortgage History
| Date | Status | Loan Amount | Loan Type |
|---|---|---|---|
| Open | $360,000 | New Conventional | |
| Closed | $360,000 | New Conventional | |
| Previous Owner | $252,450 | New Conventional | |
| Previous Owner | $35,000 | Stand Alone Second | |
| Previous Owner | $532,000 | Unknown | |
| Previous Owner | $46,000 | Credit Line Revolving | |
| Previous Owner | $378,000 | Fannie Mae Freddie Mac | |
| Previous Owner | $85,000 | Credit Line Revolving | |
| Previous Owner | $459,000 | Fannie Mae Freddie Mac | |
| Previous Owner | $264,000 | Unknown | |
| Previous Owner | $22,075 | Unknown | |
| Previous Owner | $129,000 | No Value Available | |
| Previous Owner | $17,210 | Unknown |
Source: Public Records
Property History
| Date | Event | Price | Change | Sq Ft Price |
|---|---|---|---|---|
| 10/13/2014 10/13/14 | Sold | $400,000 | 0.0% | $267 / Sq Ft |
| 08/13/2014 08/13/14 | Pending | -- | -- | -- |
| 08/12/2014 08/12/14 | For Sale | $399,999 | 0.0% | $267 / Sq Ft |
| 07/24/2014 07/24/14 | Pending | -- | -- | -- |
| 07/16/2014 07/16/14 | For Sale | $399,999 | +34.7% | $267 / Sq Ft |
| 06/16/2014 06/16/14 | Sold | $297,000 | 0.0% | $198 / Sq Ft |
| 03/29/2014 03/29/14 | Off Market | $297,000 | -- | -- |
| 03/29/2014 03/29/14 | For Sale | $250,000 | -15.8% | $167 / Sq Ft |
| 11/14/2013 11/14/13 | Off Market | $297,000 | -- | -- |
| 11/11/2013 11/11/13 | For Sale | $250,000 | +11.1% | $167 / Sq Ft |
| 04/30/2012 04/30/12 | Sold | $225,000 | 0.0% | $150 / Sq Ft |
| 03/24/2012 03/24/12 | Price Changed | $225,000 | -1.7% | $150 / Sq Ft |
| 02/03/2012 02/03/12 | Price Changed | $228,900 | -0.4% | $153 / Sq Ft |
| 01/29/2012 01/29/12 | Price Changed | $229,900 | 0.0% | $153 / Sq Ft |
| 01/27/2012 01/27/12 | Price Changed | $230,000 | -0.9% | $153 / Sq Ft |
| 01/24/2012 01/24/12 | Price Changed | $232,000 | -0.4% | $155 / Sq Ft |
| 01/13/2012 01/13/12 | Price Changed | $233,000 | -0.4% | $155 / Sq Ft |
| 01/11/2012 01/11/12 | Price Changed | $234,000 | -0.4% | $156 / Sq Ft |
| 01/05/2012 01/05/12 | Price Changed | $235,000 | -0.4% | $157 / Sq Ft |
| 01/03/2012 01/03/12 | Price Changed | $236,000 | -0.4% | $157 / Sq Ft |
| 12/29/2011 12/29/11 | Price Changed | $237,000 | -0.4% | $158 / Sq Ft |
| 12/28/2011 12/28/11 | Price Changed | $238,000 | -0.4% | $159 / Sq Ft |
| 12/27/2011 12/27/11 | Price Changed | $239,000 | -0.4% | $159 / Sq Ft |
| 09/29/2011 09/29/11 | Price Changed | $240,000 | -0.4% | $160 / Sq Ft |
| 09/28/2011 09/28/11 | Price Changed | $241,000 | -0.8% | $161 / Sq Ft |
| 09/27/2011 09/27/11 | Price Changed | $243,000 | -0.4% | $162 / Sq Ft |
| 09/26/2011 09/26/11 | Price Changed | $244,000 | -0.4% | $163 / Sq Ft |
| 09/21/2011 09/21/11 | Price Changed | $245,000 | -1.6% | $163 / Sq Ft |
| 09/19/2011 09/19/11 | Price Changed | $249,000 | -7.4% | $166 / Sq Ft |
| 09/13/2011 09/13/11 | Price Changed | $269,000 | -1.1% | $179 / Sq Ft |
| 09/12/2011 09/12/11 | Price Changed | $272,000 | -0.7% | $181 / Sq Ft |
| 09/07/2011 09/07/11 | Price Changed | $274,000 | -1.8% | $183 / Sq Ft |
| 08/27/2011 08/27/11 | Price Changed | $279,000 | -1.4% | $186 / Sq Ft |
| 08/22/2011 08/22/11 | Price Changed | $283,000 | -0.7% | $189 / Sq Ft |
| 08/21/2011 08/21/11 | Price Changed | $284,900 | 0.0% | $190 / Sq Ft |
| 08/16/2011 08/16/11 | Price Changed | $285,000 | -1.4% | $190 / Sq Ft |
| 07/07/2011 07/07/11 | For Sale | $289,000 | -- | $193 / Sq Ft |
Source: California Regional Multiple Listing Service (CRMLS)
Tax History Compared to Growth
Tax History
| Year | Tax Paid | Tax Assessment Tax Assessment Total Assessment is a certain percentage of the fair market value that is determined by local assessors to be the total taxable value of land and additions on the property. | Land | Improvement |
|---|---|---|---|---|
| 2025 | $5,905 | $480,732 | $384,589 | $96,143 |
| 2024 | $5,905 | $471,307 | $377,049 | $94,258 |
| 2023 | $5,793 | $462,066 | $369,656 | $92,410 |
| 2022 | $5,527 | $453,007 | $362,408 | $90,599 |
| 2021 | $5,455 | $444,125 | $355,302 | $88,823 |
| 2019 | $5,293 | $430,954 | $344,764 | $86,190 |
| 2018 | $5,206 | $422,504 | $338,004 | $84,500 |
| 2016 | $4,967 | $406,100 | $324,880 | $81,220 |
| 2015 | $4,895 | $400,000 | $320,000 | $80,000 |
| 2014 | $2,580 | $200,435 | $66,532 | $133,903 |
Source: Public Records
Agents Affiliated with this Home
-
C
Seller's Agent in 2014
Cesar Campos
Executive Bankers Realty
-
S
Seller's Agent in 2014
Steven Tobin
Modern Realtors Real Estate
-
C
Buyer's Agent in 2014
Cynthia Guzman
Excellence RE Real Estate
(626) 232-7927
7 Total Sales
-
Seller's Agent in 2012
Armando Gonzalez
Century 21 Allstars
(562) 708-0517
79 Total Sales
-
O
Buyer's Agent in 2012
Outside Agent
CLAW Reciprocal Listings
Map
Source: California Regional Multiple Listing Service (CRMLS)
MLS Number: Y1104261
APN: 5218-018-005
Disclaimer: Certain information contained herein is derived from information provided by parties other than Homes.com. All information provided is deemed reliable, but is not guaranteed to be accurate and should be independently verified.
![]() The multiple listing data appearing on this website, or contained in reports produced therefrom, is owned and copyrighted by California Regional Multiple Listing Service, Inc. ("CRMLS") and is protected by all applicable copyright laws. Information provided is for viewer's personal, non-commercial use and may not be used for any purpose other than to identify prospective properties the viewer may be interested in purchasing. All listing data, including but not limited to square footage and lot size is believed to be accurate, but the listing Agent, listing Broker and CRMLS and its affiliates do not warrant or guarantee such accuracy. The viewer should independently verify the listed data prior to making any decisions based on such information by personal inspection and/or contacting a real estate professional.
The multiple listing data appearing on this website, or contained in reports produced therefrom, is owned and copyrighted by California Regional Multiple Listing Service, Inc. ("CRMLS") and is protected by all applicable copyright laws. Information provided is for viewer's personal, non-commercial use and may not be used for any purpose other than to identify prospective properties the viewer may be interested in purchasing. All listing data, including but not limited to square footage and lot size is believed to be accurate, but the listing Agent, listing Broker and CRMLS and its affiliates do not warrant or guarantee such accuracy. The viewer should independently verify the listed data prior to making any decisions based on such information by personal inspection and/or contacting a real estate professional.
Based on information from California Regional Multiple Listing Service, Inc. and /or other sources. All data, including all measurements and calculations of area, is obtained from various sources and has not been, and will not be, verified by broker or MLS. All information should be independently reviewed and verified for accuracy. Properties may or may not be listed by the office/agent presenting the information
Nearby Homes
- 3204 Pueblo Ave
- 3323 Linda Vista Terrace
- 4414 Rose Hill W
- 4926 Templeton St
- 3103 Pueblo Ave
- 3100 Pueblo Ave
- 4962 Gambier St
- 5158 Templeton St
- 3309 Chadwick Dr
- 4819 Converse St
- 4772 Twining St
- 3747 Rosemead Ave
- 5013 Huntington Dr N
- 4803 Gambier St
- 2717 Chadwick Cir
- 3303 Paola Ave
- 2871 Budau Ave Unit 2
- 4003 N Drysdale
- 4836 Edison St
- 5213 Navarro St