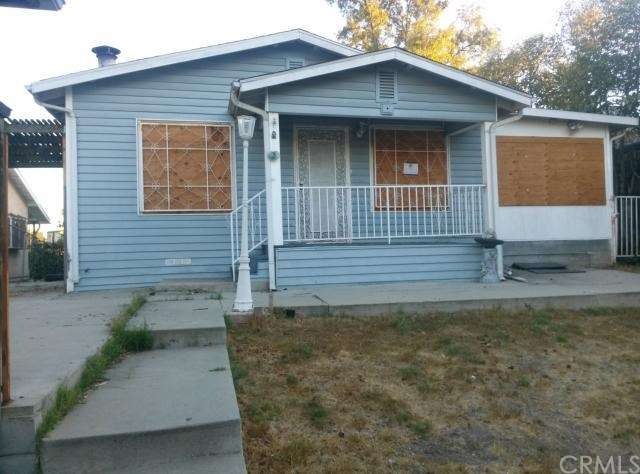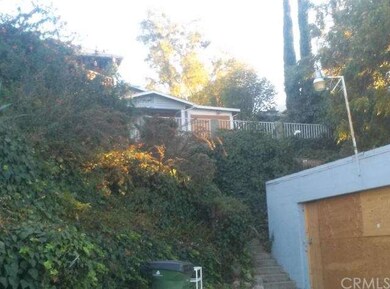
4970 Twining St Los Angeles, CA 90032
El Sereno NeighborhoodHighlights
- All Bedrooms Downstairs
- No HOA
- Fireplace
- Abraham Lincoln High School Rated A
- Neighborhood Views
- Central Heating and Cooling System
About This Home
As of October 2014Great 4 bedroom 3 bath home in the hills of boyle heights, property in need of repairs.
Last Agent to Sell the Property
Cesar Campos
Executive Bankers Realty License #01335092 Listed on: 03/29/2014
Last Buyer's Agent
Cesar Campos
Executive Bankers Realty License #01335092 Listed on: 03/29/2014
Home Details
Home Type
- Single Family
Est. Annual Taxes
- $5,905
Year Built
- Built in 1922
Lot Details
- 7,500 Sq Ft Lot
- Steep Slope
Parking
- 2 Car Garage
Interior Spaces
- 1,500 Sq Ft Home
- Fireplace
- Neighborhood Views
Bedrooms and Bathrooms
- 4 Bedrooms
- All Bedrooms Down
- 3 Full Bathrooms
Utilities
- Central Heating and Cooling System
Community Details
- No Home Owners Association
Listing and Financial Details
- Tax Lot 65
- Tax Tract Number 3385
- Assessor Parcel Number 5218018005
Ownership History
Purchase Details
Purchase Details
Home Financials for this Owner
Home Financials are based on the most recent Mortgage that was taken out on this home.Purchase Details
Home Financials for this Owner
Home Financials are based on the most recent Mortgage that was taken out on this home.Purchase Details
Home Financials for this Owner
Home Financials are based on the most recent Mortgage that was taken out on this home.Purchase Details
Home Financials for this Owner
Home Financials are based on the most recent Mortgage that was taken out on this home.Purchase Details
Home Financials for this Owner
Home Financials are based on the most recent Mortgage that was taken out on this home.Purchase Details
Home Financials for this Owner
Home Financials are based on the most recent Mortgage that was taken out on this home.Purchase Details
Similar Homes in the area
Home Values in the Area
Average Home Value in this Area
Purchase History
| Date | Type | Sale Price | Title Company |
|---|---|---|---|
| Interfamily Deed Transfer | -- | None Available | |
| Interfamily Deed Transfer | -- | None Available | |
| Interfamily Deed Transfer | -- | None Available | |
| Grant Deed | $400,000 | None Available | |
| Grant Deed | $297,000 | Provident Title | |
| Interfamily Deed Transfer | -- | -- | |
| Interfamily Deed Transfer | -- | -- | |
| Interfamily Deed Transfer | -- | Fswtc | |
| Interfamily Deed Transfer | -- | -- |
Mortgage History
| Date | Status | Loan Amount | Loan Type |
|---|---|---|---|
| Open | $360,000 | New Conventional | |
| Closed | $360,000 | New Conventional | |
| Previous Owner | $252,450 | New Conventional | |
| Previous Owner | $35,000 | Stand Alone Second | |
| Previous Owner | $532,000 | Unknown | |
| Previous Owner | $46,000 | Credit Line Revolving | |
| Previous Owner | $378,000 | Fannie Mae Freddie Mac | |
| Previous Owner | $85,000 | Credit Line Revolving | |
| Previous Owner | $459,000 | Fannie Mae Freddie Mac | |
| Previous Owner | $264,000 | Unknown | |
| Previous Owner | $22,075 | Unknown | |
| Previous Owner | $129,000 | No Value Available | |
| Previous Owner | $17,210 | Unknown |
Property History
| Date | Event | Price | Change | Sq Ft Price |
|---|---|---|---|---|
| 10/13/2014 10/13/14 | Sold | $400,000 | 0.0% | $267 / Sq Ft |
| 08/13/2014 08/13/14 | Pending | -- | -- | -- |
| 08/12/2014 08/12/14 | For Sale | $399,999 | 0.0% | $267 / Sq Ft |
| 07/24/2014 07/24/14 | Pending | -- | -- | -- |
| 07/16/2014 07/16/14 | For Sale | $399,999 | +34.7% | $267 / Sq Ft |
| 06/16/2014 06/16/14 | Sold | $297,000 | 0.0% | $198 / Sq Ft |
| 03/29/2014 03/29/14 | Off Market | $297,000 | -- | -- |
| 03/29/2014 03/29/14 | For Sale | $250,000 | -15.8% | $167 / Sq Ft |
| 11/14/2013 11/14/13 | Off Market | $297,000 | -- | -- |
| 11/11/2013 11/11/13 | For Sale | $250,000 | +11.1% | $167 / Sq Ft |
| 04/30/2012 04/30/12 | Sold | $225,000 | 0.0% | $150 / Sq Ft |
| 03/24/2012 03/24/12 | Price Changed | $225,000 | -1.7% | $150 / Sq Ft |
| 02/03/2012 02/03/12 | Price Changed | $228,900 | -0.4% | $153 / Sq Ft |
| 01/29/2012 01/29/12 | Price Changed | $229,900 | 0.0% | $153 / Sq Ft |
| 01/27/2012 01/27/12 | Price Changed | $230,000 | -0.9% | $153 / Sq Ft |
| 01/24/2012 01/24/12 | Price Changed | $232,000 | -0.4% | $155 / Sq Ft |
| 01/13/2012 01/13/12 | Price Changed | $233,000 | -0.4% | $155 / Sq Ft |
| 01/11/2012 01/11/12 | Price Changed | $234,000 | -0.4% | $156 / Sq Ft |
| 01/05/2012 01/05/12 | Price Changed | $235,000 | -0.4% | $157 / Sq Ft |
| 01/03/2012 01/03/12 | Price Changed | $236,000 | -0.4% | $157 / Sq Ft |
| 12/29/2011 12/29/11 | Price Changed | $237,000 | -0.4% | $158 / Sq Ft |
| 12/28/2011 12/28/11 | Price Changed | $238,000 | -0.4% | $159 / Sq Ft |
| 12/27/2011 12/27/11 | Price Changed | $239,000 | -0.4% | $159 / Sq Ft |
| 09/29/2011 09/29/11 | Price Changed | $240,000 | -0.4% | $160 / Sq Ft |
| 09/28/2011 09/28/11 | Price Changed | $241,000 | -0.8% | $161 / Sq Ft |
| 09/27/2011 09/27/11 | Price Changed | $243,000 | -0.4% | $162 / Sq Ft |
| 09/26/2011 09/26/11 | Price Changed | $244,000 | -0.4% | $163 / Sq Ft |
| 09/21/2011 09/21/11 | Price Changed | $245,000 | -1.6% | $163 / Sq Ft |
| 09/19/2011 09/19/11 | Price Changed | $249,000 | -7.4% | $166 / Sq Ft |
| 09/13/2011 09/13/11 | Price Changed | $269,000 | -1.1% | $179 / Sq Ft |
| 09/12/2011 09/12/11 | Price Changed | $272,000 | -0.7% | $181 / Sq Ft |
| 09/07/2011 09/07/11 | Price Changed | $274,000 | -1.8% | $183 / Sq Ft |
| 08/27/2011 08/27/11 | Price Changed | $279,000 | -1.4% | $186 / Sq Ft |
| 08/22/2011 08/22/11 | Price Changed | $283,000 | -0.7% | $189 / Sq Ft |
| 08/21/2011 08/21/11 | Price Changed | $284,900 | 0.0% | $190 / Sq Ft |
| 08/16/2011 08/16/11 | Price Changed | $285,000 | -1.4% | $190 / Sq Ft |
| 07/07/2011 07/07/11 | For Sale | $289,000 | -- | $193 / Sq Ft |
Tax History Compared to Growth
Tax History
| Year | Tax Paid | Tax Assessment Tax Assessment Total Assessment is a certain percentage of the fair market value that is determined by local assessors to be the total taxable value of land and additions on the property. | Land | Improvement |
|---|---|---|---|---|
| 2025 | $5,905 | $480,732 | $384,589 | $96,143 |
| 2024 | $5,905 | $471,307 | $377,049 | $94,258 |
| 2023 | $5,793 | $462,066 | $369,656 | $92,410 |
| 2022 | $5,527 | $453,007 | $362,408 | $90,599 |
| 2021 | $5,455 | $444,125 | $355,302 | $88,823 |
| 2019 | $5,293 | $430,954 | $344,764 | $86,190 |
| 2018 | $5,206 | $422,504 | $338,004 | $84,500 |
| 2016 | $4,967 | $406,100 | $324,880 | $81,220 |
| 2015 | $4,895 | $400,000 | $320,000 | $80,000 |
| 2014 | $2,580 | $200,435 | $66,532 | $133,903 |
Agents Affiliated with this Home
-
C
Seller's Agent in 2014
Cesar Campos
Executive Bankers Realty
-
S
Seller's Agent in 2014
Steven Tobin
Modern Realtors Real Estate
-
C
Buyer's Agent in 2014
Cynthia Guzman
Excellence RE Real Estate
(626) 232-7927
7 Total Sales
-

Seller's Agent in 2012
Armando Gonzalez
Century 21 Allstars
(562) 708-0517
79 Total Sales
-
O
Buyer's Agent in 2012
Outside Agent
CLAW Reciprocal Listings
Map
Source: California Regional Multiple Listing Service (CRMLS)
MLS Number: RS13231243
APN: 5218-018-005
- 3204 Pueblo Ave
- 3323 Linda Vista Terrace
- 4414 Rose Hill W
- 4926 Templeton St
- 3103 Pueblo Ave
- 3100 Pueblo Ave
- 4962 Gambier St
- 5158 Templeton St
- 3309 Chadwick Dr
- 4819 Converse St
- 4772 Twining St
- 3747 Rosemead Ave
- 5013 Huntington Dr N
- 4803 Gambier St
- 2717 Chadwick Cir
- 3303 Paola Ave
- 2871 Budau Ave Unit 2
- 4003 N Drysdale
- 4836 Edison St
- 5213 Navarro St

