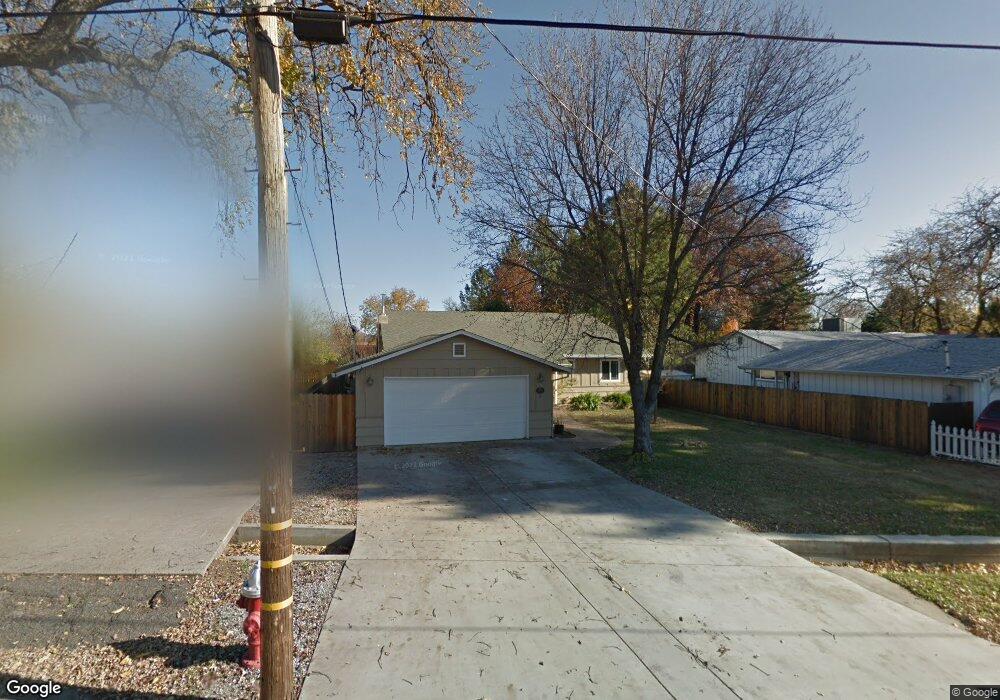
4979 Bidwell Rd Unit 1 Redding, CA 96001
Bonnyview NeighborhoodEstimated Value: $304,000 - $418,835
3
Beds
1
Bath
1,150
Sq Ft
$320/Sq Ft
Est. Value
About This Home
This home is located at 4979 Bidwell Rd Unit 1, Redding, CA 96001 and is currently estimated at $368,459, approximately $320 per square foot. 4979 Bidwell Rd Unit 1 is a home located in Shasta County with nearby schools including Bonny View Elementary School, Sequoia Middle School, and Shasta High School.
Ownership History
Date
Name
Owned For
Owner Type
Purchase Details
Closed on
May 7, 2003
Sold by
Watson Stephen W and Watson Patricia R
Bought by
Watson Stephen W and Watson Patricia
Current Estimated Value
Home Financials for this Owner
Home Financials are based on the most recent Mortgage that was taken out on this home.
Original Mortgage
$105,000
Outstanding Balance
$45,801
Interest Rate
5.84%
Estimated Equity
$322,658
Purchase Details
Closed on
Apr 18, 2002
Sold by
Espy David and Espy Shannon
Bought by
Watson Stephen W and Watson Patricia R
Home Financials for this Owner
Home Financials are based on the most recent Mortgage that was taken out on this home.
Original Mortgage
$92,000
Interest Rate
6.87%
Purchase Details
Closed on
Jun 2, 1998
Sold by
Barak Covert and Marie Dawn
Bought by
Espy David and Espy Shannon
Home Financials for this Owner
Home Financials are based on the most recent Mortgage that was taken out on this home.
Original Mortgage
$76,500
Interest Rate
8.5%
Create a Home Valuation Report for This Property
The Home Valuation Report is an in-depth analysis detailing your home's value as well as a comparison with similar homes in the area
Home Values in the Area
Average Home Value in this Area
Purchase History
| Date | Buyer | Sale Price | Title Company |
|---|---|---|---|
| Watson Stephen W | -- | Alliance Title Company | |
| Watson Stephen W | $115,000 | Alliance Title Company | |
| Espy David | $90,000 | First American Title Co |
Source: Public Records
Mortgage History
| Date | Status | Borrower | Loan Amount |
|---|---|---|---|
| Open | Watson Stephen W | $105,000 | |
| Closed | Watson Stephen W | $92,000 | |
| Previous Owner | Espy David | $76,500 | |
| Closed | Espy David | $9,000 | |
| Closed | Watson Stephen W | $11,500 |
Source: Public Records
Tax History
| Year | Tax Paid | Tax Assessment Tax Assessment Total Assessment is a certain percentage of the fair market value that is determined by local assessors to be the total taxable value of land and additions on the property. | Land | Improvement |
|---|---|---|---|---|
| 2025 | $2,386 | $236,487 | $39,877 | $196,610 |
| 2024 | $2,348 | $231,851 | $39,096 | $192,755 |
| 2023 | $2,348 | $227,306 | $38,330 | $188,976 |
| 2022 | $2,307 | $222,850 | $37,579 | $185,271 |
| 2021 | $2,294 | $218,482 | $36,843 | $181,639 |
| 2020 | $2,324 | $216,243 | $36,466 | $179,777 |
| 2019 | $2,205 | $212,003 | $35,751 | $176,252 |
| 2018 | $2,223 | $207,847 | $35,050 | $172,797 |
| 2017 | $2,210 | $203,772 | $34,363 | $169,409 |
| 2016 | $2,138 | $199,778 | $33,690 | $166,088 |
| 2015 | $2,110 | $196,778 | $33,184 | $163,594 |
| 2014 | $2,094 | $192,924 | $32,534 | $160,390 |
Source: Public Records
Map
Nearby Homes
- 4540 Cerro Ln
- 4920 Bonnyview Ave
- 2340 Wilsey Dr
- 0 Lot4 Unit 2 Ph 2 Stillwater Unit 25-4962
- 0 Lot3 Unit 2 Ph 2 Stillwater Unit 25-4961
- 0 Lot6 Unit 2 Ph 2 Stillwater Unit 25-4964
- 0 Lot5 Unit 2 Ph 2 Stillwater Unit 25-4963
- 0 Lot16 Unit 2 Ph 2 Stillwater Unit 25-4958
- 0 Lot9 Unit 2 Ph 2 Stillwater Unit 25-4967
- 0 Lot2 Unit 2 Ph 2 Stillwater Unit 25-4960
- 0 Lot11 Unit 2 Ph 2 Stillwater Unit 25-4953
- 0 Lot10 Unit 2 Ph 2 Stillwater Unit 25-4952
- 0 Lot7 Unit 2 Ph 2 Stillwater Unit 25-4965
- 3232 Nicolet Ln
- 3622 Ginny Ct
- 2230 El Reno Ln
- 0000 Wyndham Pointe Subdivision
- 5367 Rosswood Ln
- 4410 Westside Rd
- 5443 Rosswood St
- 4979 Bidwell Rd
- 4969 Bidwell Rd
- 5013 Bidwell Rd
- 4937 Bidwell Rd
- 4434 E Bonnyview Rd
- 5039 Bidwell Rd
- 4938 Bidwell Rd
- 5045 Bidwell Rd
- 4430 E Bonnyview Rd
- 4921 Bidwell Rd
- 4440 E Bonnyview Rd
- 4450 E Bonnyview Rd
- 4928 Bidwell Rd
- 5049 Bidwell Rd
- 4595 Cerro Ln
- 4426 E Bonnyview Rd
- 5047 Bidwell Rd
- 4585 Cerro Ln
- 4575 Cerro Ln
- 4422 E Bonnyview Rd Unit 1
Your Personal Tour Guide
Ask me questions while you tour the home.