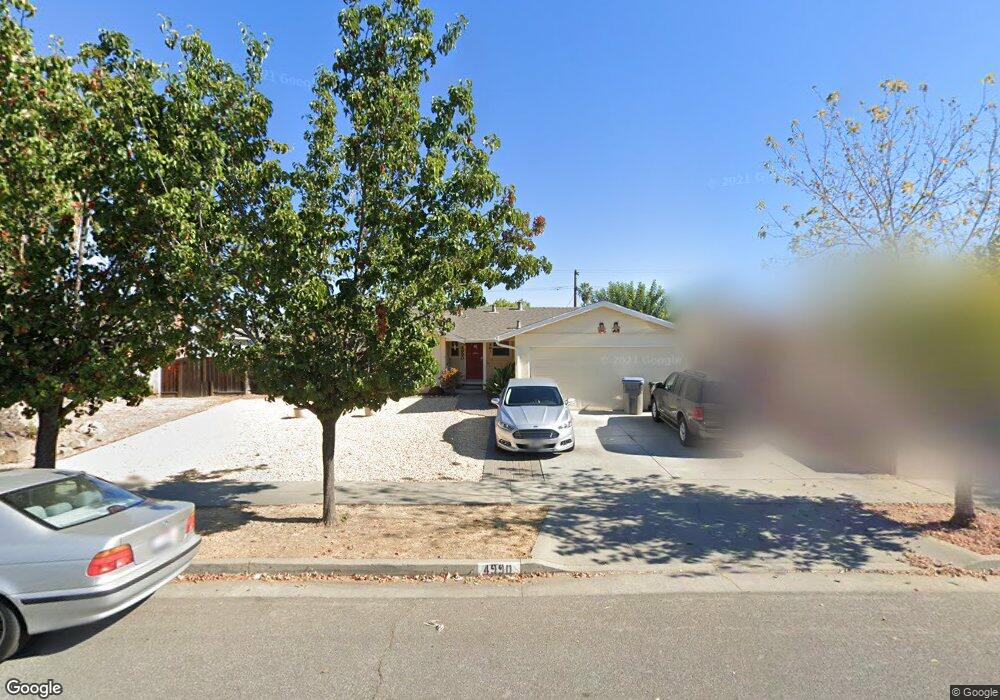
4990 Jarvis Ave San Jose, CA 95118
Valley View-Reed NeighborhoodEstimated Value: $1,296,000 - $1,538,000
3
Beds
2
Baths
1,188
Sq Ft
$1,222/Sq Ft
Est. Value
About This Home
This home is located at 4990 Jarvis Ave, San Jose, CA 95118 and is currently estimated at $1,451,901, approximately $1,222 per square foot. 4990 Jarvis Ave is a home located in Santa Clara County with nearby schools including Almaden Elementary School, John Muir Middle School, and Pioneer High School.
Ownership History
Date
Name
Owned For
Owner Type
Purchase Details
Closed on
Sep 21, 2020
Sold by
Dobrenz Peggy L
Bought by
Dobrenz Peggy L and Dobrenz 2020 Family Trust
Current Estimated Value
Purchase Details
Closed on
Aug 31, 2020
Sold by
Mccarry Michael
Bought by
Dobrenz Peggy L
Purchase Details
Closed on
Jun 17, 2017
Sold by
Dobrenz Peggy L
Bought by
Dobrenz Peggy L and Mccarry Michael
Home Financials for this Owner
Home Financials are based on the most recent Mortgage that was taken out on this home.
Original Mortgage
$417,175
Interest Rate
3.37%
Mortgage Type
FHA
Purchase Details
Closed on
Aug 9, 2004
Sold by
Sogge Erik O and Burk Genevieve N
Bought by
Dobrenz Peggy L
Home Financials for this Owner
Home Financials are based on the most recent Mortgage that was taken out on this home.
Original Mortgage
$462,400
Interest Rate
4.03%
Mortgage Type
Negative Amortization
Purchase Details
Closed on
May 18, 2004
Sold by
Sogge Erik O
Bought by
Sogge Erik O and Burk Genevieve N
Home Financials for this Owner
Home Financials are based on the most recent Mortgage that was taken out on this home.
Original Mortgage
$432,000
Interest Rate
4.37%
Mortgage Type
New Conventional
Purchase Details
Closed on
Aug 6, 2003
Sold by
Burk Genevieve N
Bought by
Sogge Erik O
Home Financials for this Owner
Home Financials are based on the most recent Mortgage that was taken out on this home.
Original Mortgage
$322,700
Interest Rate
5.29%
Mortgage Type
Purchase Money Mortgage
Purchase Details
Closed on
Jun 7, 2000
Sold by
Deselle Linda A Trustee
Bought by
Sogge Erik O and Burk Genevieve N
Home Financials for this Owner
Home Financials are based on the most recent Mortgage that was taken out on this home.
Original Mortgage
$300,000
Interest Rate
8.37%
Purchase Details
Closed on
Dec 10, 1997
Sold by
Deselle Linda A
Bought by
Deselle Linda A
Home Financials for this Owner
Home Financials are based on the most recent Mortgage that was taken out on this home.
Original Mortgage
$112,000
Interest Rate
7.3%
Purchase Details
Closed on
Nov 11, 1997
Sold by
Deselle Linda A
Bought by
Deselle Linda A
Home Financials for this Owner
Home Financials are based on the most recent Mortgage that was taken out on this home.
Original Mortgage
$112,000
Interest Rate
7.3%
Purchase Details
Closed on
Aug 19, 1995
Sold by
Deselle David S and Deselle Linda A
Bought by
Deselle David S and Deselle Linda A
Create a Home Valuation Report for This Property
The Home Valuation Report is an in-depth analysis detailing your home's value as well as a comparison with similar homes in the area
Home Values in the Area
Average Home Value in this Area
Purchase History
| Date | Buyer | Sale Price | Title Company |
|---|---|---|---|
| Dobrenz Peggy L | -- | None Available | |
| Dobrenz Peggy L | -- | None Available | |
| Dobrenz Peggy L | -- | Wfg Lender Services | |
| Dobrenz Peggy L | $578,000 | Alliance Title Company | |
| Sogge Erik O | -- | Commonwealth Title | |
| Sogge Erik O | -- | North American Title Co | |
| Sogge Erik O | $375,000 | Fidelity National Title Co | |
| Deselle Linda A | -- | -- | |
| Deselle Linda A | -- | Chicago Title Co | |
| Deselle David S | -- | -- |
Source: Public Records
Mortgage History
| Date | Status | Borrower | Loan Amount |
|---|---|---|---|
| Previous Owner | Dobrenz Peggy L | $417,175 | |
| Previous Owner | Dobrenz Peggy L | $462,400 | |
| Previous Owner | Sogge Erik O | $432,000 | |
| Previous Owner | Sogge Erik O | $322,700 | |
| Previous Owner | Sogge Erik O | $300,000 | |
| Previous Owner | Deselle Linda A | $112,000 | |
| Closed | Sogge Erik O | $37,500 | |
| Closed | Sogge Erik O | $40,000 |
Source: Public Records
Tax History Compared to Growth
Tax History
| Year | Tax Paid | Tax Assessment Tax Assessment Total Assessment is a certain percentage of the fair market value that is determined by local assessors to be the total taxable value of land and additions on the property. | Land | Improvement |
|---|---|---|---|---|
| 2025 | $10,571 | $805,661 | $483,400 | $322,261 |
| 2024 | $10,571 | $789,865 | $473,922 | $315,943 |
| 2023 | $10,360 | $774,379 | $464,630 | $309,749 |
| 2022 | $10,270 | $759,196 | $455,520 | $303,676 |
| 2021 | $10,048 | $744,311 | $446,589 | $297,722 |
| 2020 | $9,811 | $736,680 | $442,010 | $294,670 |
| 2019 | $9,596 | $722,237 | $433,344 | $288,893 |
| 2018 | $9,512 | $708,077 | $424,848 | $283,229 |
| 2017 | $9,415 | $694,194 | $416,518 | $277,676 |
| 2016 | $9,235 | $680,583 | $408,351 | $272,232 |
| 2015 | $9,171 | $670,361 | $402,218 | $268,143 |
| 2014 | $8,718 | $657,231 | $394,340 | $262,891 |
Source: Public Records
Map
Nearby Homes
- 5092 Trenary Way
- 1264 Bouret Dr Unit 4
- 1359 Shawn Dr Unit 4
- 1448 Luning Dr
- 1448 Lansing Ave
- 1372 Branham Ln Unit 1
- 5454 Russo Dr
- 5321 Garwood Dr
- 1398 Boysea Dr
- 1155 Illiad Ct
- 1115 Odyssey Ct
- 4450 Silva Ave
- 5559 Russo Dr
- 4570 Waterville Dr
- 5138 El Roble Ct
- 4519 Waterville Dr
- 4501 Waterville Dr
- 5400 Southbridge Ct
- 1299 Foxwood Dr
- 4460 Lahaina Way
- 4998 Jarvis Ave
- 4982 Jarvis Ave
- 5001 Tifton Way
- 5009 Tifton Way
- 4987 Tifton Way
- 4974 Jarvis Ave
- 5012 Jarvis Ave
- 5015 Tifton Way
- 4979 Tifton Way
- 4995 Jarvis Ave
- 4981 Jarvis Ave
- 5018 Jarvis Ave
- 4966 Jarvis Ave
- 5025 Tifton Way
- 4971 Tifton Way
- 4967 Jarvis Ave
- 5015 Jarvis Ave
- 5035 Tifton Way
- 4961 Tifton Way
- 5026 Jarvis Ave