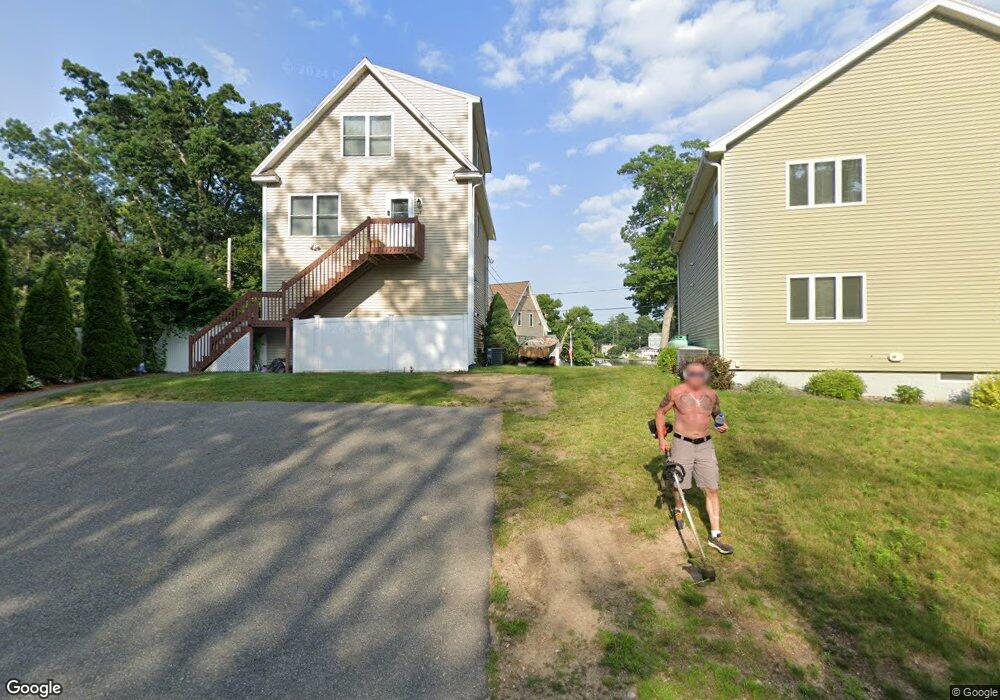
49A Sandy Beach Rd Salem, NH 03079
Arlington Pond NeighborhoodEstimated Value: $682,000 - $956,832
2
Beds
3
Baths
1,949
Sq Ft
$440/Sq Ft
Est. Value
About This Home
This home is located at 49A Sandy Beach Rd, Salem, NH 03079 and is currently estimated at $857,958, approximately $440 per square foot. 49A Sandy Beach Rd is a home located in Rockingham County with nearby schools including North Salem Elementary School, Woodbury School, and Salem High School.
Ownership History
Date
Name
Owned For
Owner Type
Purchase Details
Closed on
Aug 28, 2013
Sold by
Wieland Matthew C and Wieland Carrie A
Bought by
Carrie A Wieland Ret
Current Estimated Value
Purchase Details
Closed on
Oct 30, 2000
Sold by
Golembewski Timothy
Bought by
Wieland Matthew C
Home Financials for this Owner
Home Financials are based on the most recent Mortgage that was taken out on this home.
Original Mortgage
$108,000
Interest Rate
7.83%
Mortgage Type
Purchase Money Mortgage
Create a Home Valuation Report for This Property
The Home Valuation Report is an in-depth analysis detailing your home's value as well as a comparison with similar homes in the area
Home Values in the Area
Average Home Value in this Area
Purchase History
| Date | Buyer | Sale Price | Title Company |
|---|---|---|---|
| Carrie A Wieland Ret | -- | -- | |
| Wieland Matthew C | $120,000 | -- |
Source: Public Records
Mortgage History
| Date | Status | Borrower | Loan Amount |
|---|---|---|---|
| Previous Owner | Wieland Matthew C | $390,000 | |
| Previous Owner | Wieland Matthew C | $200,000 | |
| Previous Owner | Wieland Matthew C | $108,000 |
Source: Public Records
Tax History
| Year | Tax Paid | Tax Assessment Tax Assessment Total Assessment is a certain percentage of the fair market value that is determined by local assessors to be the total taxable value of land and additions on the property. | Land | Improvement |
|---|---|---|---|---|
| 2024 | $13,233 | $751,900 | $389,600 | $362,300 |
| 2023 | $12,752 | $751,900 | $389,600 | $362,300 |
| 2022 | $12,068 | $751,900 | $389,600 | $362,300 |
| 2021 | $12,015 | $751,900 | $389,600 | $362,300 |
| 2020 | $11,684 | $530,600 | $278,300 | $252,300 |
| 2019 | $11,663 | $530,600 | $278,300 | $252,300 |
| 2018 | $10,667 | $530,600 | $278,300 | $252,300 |
| 2017 | $10,840 | $530,600 | $278,300 | $252,300 |
| 2016 | $10,840 | $530,600 | $278,300 | $252,300 |
| 2015 | $9,187 | $429,500 | $184,800 | $244,700 |
| 2014 | $8,715 | $419,200 | $184,800 | $234,400 |
| 2013 | $8,577 | $419,200 | $184,800 | $234,400 |
Source: Public Records
Map
Nearby Homes
- 182 Shore Dr
- 60 Shore Dr
- 3 Longview Dr Unit 305
- 1 Longview Dr Unit 110
- 1 Longview Dr Unit 203
- 1 Longview Dr Unit 101
- 1 Longview Dr Unit 108
- 1 Longview Dr Unit 401
- 1 Longview Dr Unit 306
- 1 Longview Dr Unit 205
- 1 Longview Dr Unit 106
- 1 Longview Dr Unit 210
- 8 Stoneybrook Ln
- 69 Caddy Dr
- 71 Caddy Dr
- 65 Caddy Dr
- 84 Caddy Dr
- 29 London Rd
- 27 London Rd
- 55A Millville Cir
Your Personal Tour Guide
Ask me questions while you tour the home.