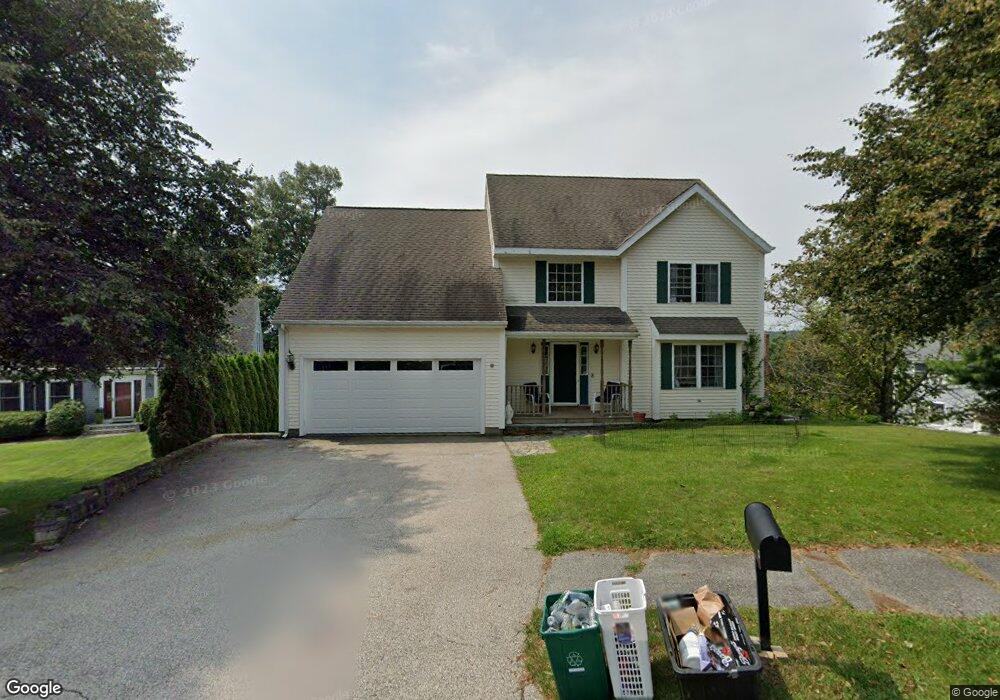
5 Arapaho Rd Worcester, MA 01606
Indian Hill NeighborhoodEstimated Value: $486,781 - $625,000
3
Beds
2
Baths
1,758
Sq Ft
$311/Sq Ft
Est. Value
About This Home
This home is located at 5 Arapaho Rd, Worcester, MA 01606 and is currently estimated at $545,945, approximately $310 per square foot. 5 Arapaho Rd is a home located in Worcester County with nearby schools including Nelson Place Elementary School, Jacob Hiatt Magnet School, and Chandler Magnet.
Ownership History
Date
Name
Owned For
Owner Type
Purchase Details
Closed on
Dec 1, 1999
Sold by
Vantage Point Homes
Bought by
Caligaris Steven P and Caligaris Deborah A
Current Estimated Value
Home Financials for this Owner
Home Financials are based on the most recent Mortgage that was taken out on this home.
Original Mortgage
$180,000
Interest Rate
7.86%
Mortgage Type
Purchase Money Mortgage
Purchase Details
Closed on
Sep 11, 1998
Sold by
Jeanne Morin Ret and Morin Daniel J
Bought by
Schuster Beth C
Purchase Details
Closed on
Oct 20, 1989
Sold by
Indian Hill Rt
Bought by
Morin Wilfred
Home Financials for this Owner
Home Financials are based on the most recent Mortgage that was taken out on this home.
Original Mortgage
$45,000
Interest Rate
10.06%
Mortgage Type
Purchase Money Mortgage
Create a Home Valuation Report for This Property
The Home Valuation Report is an in-depth analysis detailing your home's value as well as a comparison with similar homes in the area
Home Values in the Area
Average Home Value in this Area
Purchase History
| Date | Buyer | Sale Price | Title Company |
|---|---|---|---|
| Caligaris Steven P | $199,900 | -- | |
| Schuster Beth C | $46,000 | -- | |
| Morin Wilfred | $50,000 | -- |
Source: Public Records
Mortgage History
| Date | Status | Borrower | Loan Amount |
|---|---|---|---|
| Open | Morin Wilfred | $189,500 | |
| Closed | Morin Wilfred | $180,000 | |
| Previous Owner | Morin Wilfred | $45,000 | |
| Closed | Morin Wilfred | $147,477 |
Source: Public Records
Tax History
| Year | Tax Paid | Tax Assessment Tax Assessment Total Assessment is a certain percentage of the fair market value that is determined by local assessors to be the total taxable value of land and additions on the property. | Land | Improvement |
|---|---|---|---|---|
| 2025 | $5,792 | $439,100 | $118,000 | $321,100 |
| 2024 | $5,715 | $415,600 | $118,000 | $297,600 |
| 2023 | $5,497 | $383,300 | $102,600 | $280,700 |
| 2022 | $5,079 | $333,900 | $82,100 | $251,800 |
| 2021 | $4,939 | $303,400 | $65,600 | $237,800 |
| 2020 | $4,784 | $281,400 | $65,700 | $215,700 |
| 2019 | $4,606 | $255,900 | $59,100 | $196,800 |
| 2018 | $4,576 | $242,000 | $59,100 | $182,900 |
| 2017 | $4,398 | $228,800 | $59,100 | $169,700 |
| 2016 | $4,378 | $212,400 | $43,100 | $169,300 |
| 2015 | $4,263 | $212,400 | $43,100 | $169,300 |
| 2014 | $4,150 | $212,400 | $43,100 | $169,300 |
Source: Public Records
Map
Nearby Homes
- 37 Mohave Rd
- 41 Mohave Rd
- 82 Holden St
- 42 N Worcester Ave
- 97 Parkton Ave
- 667 Grove St
- 25 Chester St
- 90 Bjorklund Ave
- 39 Whitmarsh Ave
- 30 Danielles Way
- 120 Brattle St
- 11 Holden St
- 0 Grove St
- 270 Brattle St
- 12 Tattan Farm Rd
- 15 Ericsson St
- 158 Chester St
- 44 Boardman St
- 31 Boardman St
- 169 Whitmarsh Ave
Your Personal Tour Guide
Ask me questions while you tour the home.