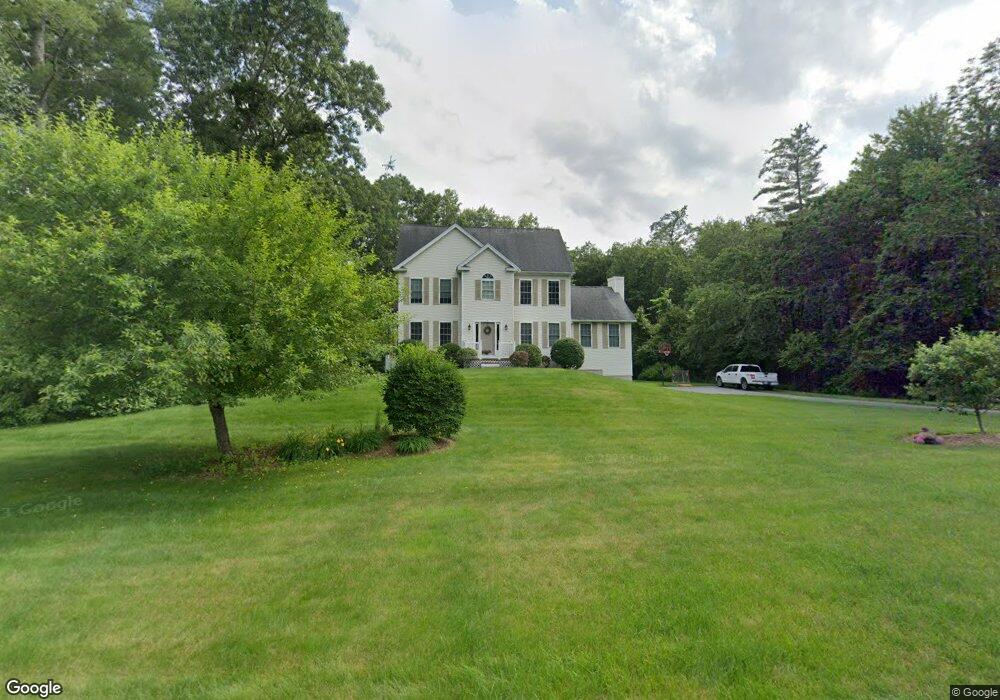
5 Aspen St Salem, NH 03079
North Salem NeighborhoodEstimated Value: $784,000 - $858,000
4
Beds
3
Baths
2,432
Sq Ft
$336/Sq Ft
Est. Value
About This Home
This home is located at 5 Aspen St, Salem, NH 03079 and is currently estimated at $816,724, approximately $335 per square foot. 5 Aspen St is a home located in Rockingham County with nearby schools including North Salem Elementary School, Woodbury School, and Salem High School.
Ownership History
Date
Name
Owned For
Owner Type
Purchase Details
Closed on
Nov 26, 2002
Sold by
Prolim Dev Corp
Bought by
Callahan David P and Callahan Lisa A
Current Estimated Value
Home Financials for this Owner
Home Financials are based on the most recent Mortgage that was taken out on this home.
Original Mortgage
$282,000
Interest Rate
6.07%
Create a Home Valuation Report for This Property
The Home Valuation Report is an in-depth analysis detailing your home's value as well as a comparison with similar homes in the area
Home Values in the Area
Average Home Value in this Area
Purchase History
| Date | Buyer | Sale Price | Title Company |
|---|---|---|---|
| Callahan David P | $389,900 | -- |
Source: Public Records
Mortgage History
| Date | Status | Borrower | Loan Amount |
|---|---|---|---|
| Open | Callahan David P | $257,000 | |
| Closed | Callahan David P | $263,000 | |
| Closed | Callahan David P | $266,000 | |
| Closed | Callahan David P | $282,000 |
Source: Public Records
Tax History Compared to Growth
Tax History
| Year | Tax Paid | Tax Assessment Tax Assessment Total Assessment is a certain percentage of the fair market value that is determined by local assessors to be the total taxable value of land and additions on the property. | Land | Improvement |
|---|---|---|---|---|
| 2024 | $9,622 | $546,700 | $190,500 | $356,200 |
| 2023 | $9,272 | $546,700 | $190,500 | $356,200 |
| 2022 | $8,775 | $546,700 | $190,500 | $356,200 |
| 2021 | $8,736 | $546,700 | $190,500 | $356,200 |
| 2020 | $8,572 | $389,300 | $135,900 | $253,400 |
| 2019 | $8,557 | $389,300 | $135,900 | $253,400 |
| 2018 | $8,413 | $389,300 | $135,900 | $253,400 |
| 2017 | $8,113 | $389,300 | $135,900 | $253,400 |
| 2016 | $7,953 | $389,300 | $135,900 | $253,400 |
| 2015 | $7,487 | $350,000 | $133,900 | $216,100 |
| 2014 | $7,277 | $350,000 | $133,900 | $216,100 |
| 2013 | $7,161 | $350,000 | $133,900 | $216,100 |
Source: Public Records
Map
Nearby Homes
- 29 Hawk Dr
- 16 Autumn Woods Rd
- 69 Caddy Dr
- 84 Caddy Dr
- 34 Shore Dr
- 26 King St
- 60 Shore Dr
- 21 Teague Dr
- 10 Independence Dr
- 3 Evergreen Way
- 136 Shore Dr
- 27 Norwood Rd
- 7 Evergreen Way
- 44 Trails Edge Rd
- 41 Trails Edge Rd
- 114 Chases Grove Rd
- 24 Rockingham Rd
- 116 Chases Grove Rd
- 120 Chases Grove Rd
- 117C Chases Grove Rd