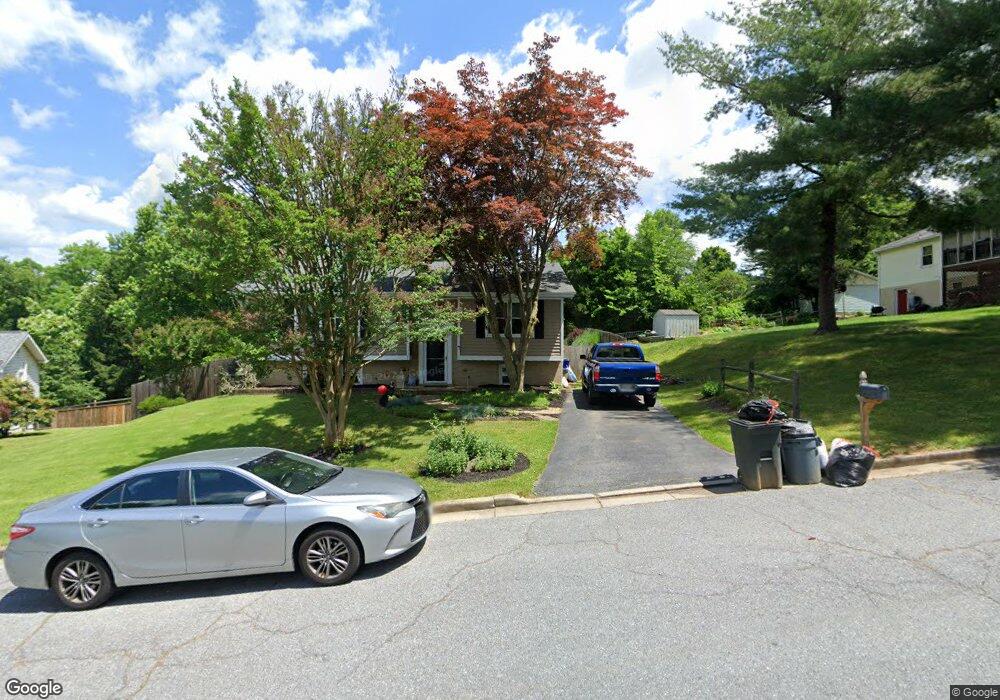
5 Chatham Ct Brunswick, MD 21716
Estimated Value: $265,000 - $345,000
Studio
1
Bath
1,068
Sq Ft
$292/Sq Ft
Est. Value
About This Home
This home is located at 5 Chatham Ct, Brunswick, MD 21716 and is currently estimated at $312,002, approximately $292 per square foot. 5 Chatham Ct is a home located in Frederick County with nearby schools including Brunswick Elementary School, Brunswick Middle School, and Brunswick High School.
Ownership History
Date
Name
Owned For
Owner Type
Purchase Details
Closed on
Jun 24, 2004
Sold by
Jensen Tracy Renee
Bought by
Jensen Tracy Renee and Wenerd Jacklyn
Current Estimated Value
Purchase Details
Closed on
Jul 11, 2002
Sold by
Jensen Tracy Renee
Bought by
Jensen Tracy Renee
Purchase Details
Closed on
Oct 30, 1998
Sold by
Wiles Gerald D and Wiles Barbara A
Bought by
Jensen Tracy Renee and Barb Melissa Faith
Create a Home Valuation Report for This Property
The Home Valuation Report is an in-depth analysis detailing your home's value as well as a comparison with similar homes in the area
Home Values in the Area
Average Home Value in this Area
Purchase History
| Date | Buyer | Sale Price | Title Company |
|---|---|---|---|
| Jensen Tracy Renee | -- | -- | |
| Jensen Tracy Renee | -- | -- | |
| Jensen Tracy Renee | $121,500 | -- |
Source: Public Records
Mortgage History
| Date | Status | Borrower | Loan Amount |
|---|---|---|---|
| Closed | Jensen Tracy Renee | -- |
Source: Public Records
Tax History
| Year | Tax Paid | Tax Assessment Tax Assessment Total Assessment is a certain percentage of the fair market value that is determined by local assessors to be the total taxable value of land and additions on the property. | Land | Improvement |
|---|---|---|---|---|
| 2025 | $3,857 | $259,400 | -- | -- |
| 2024 | $3,857 | $233,700 | $89,400 | $144,300 |
| 2023 | $3,582 | $223,500 | $0 | $0 |
| 2022 | $3,422 | $213,300 | $0 | $0 |
| 2021 | $3,112 | $203,100 | $63,800 | $139,300 |
| 2020 | $3,112 | $193,467 | $0 | $0 |
| 2019 | $2,962 | $183,833 | $0 | $0 |
| 2018 | $2,861 | $174,200 | $51,100 | $123,100 |
| 2017 | $2,827 | $174,200 | $0 | $0 |
| 2016 | $3,098 | $171,867 | $0 | $0 |
| 2015 | $3,098 | $170,700 | $0 | $0 |
| 2014 | $3,098 | $170,700 | $0 | $0 |
Source: Public Records
Map
Nearby Homes
- 21 W Orndorff Dr
- 11 W I St
- 23 E F St
- 519 N Maple Ave
- TBB Shenandoah View Pkwy Unit ORCHID
- TBB Shenandoah View Pkwy Unit DAHLIA
- 37 E C St
- 0 E D St Unit MDFR2057714
- Homesite 232 Potomac View Pkwy
- 13 E C St
- 1602C New York Ave
- 7 W B St
- 1211 Long Farm Ln
- 805 E B St
- 15 N Maryland Ave
- 8 S Maple Ave
- 8 N Virginia Ave
- 9 9th Ave
- 709 E Potomac St
- 812 Kaplon Ct
Your Personal Tour Guide
Ask me questions while you tour the home.