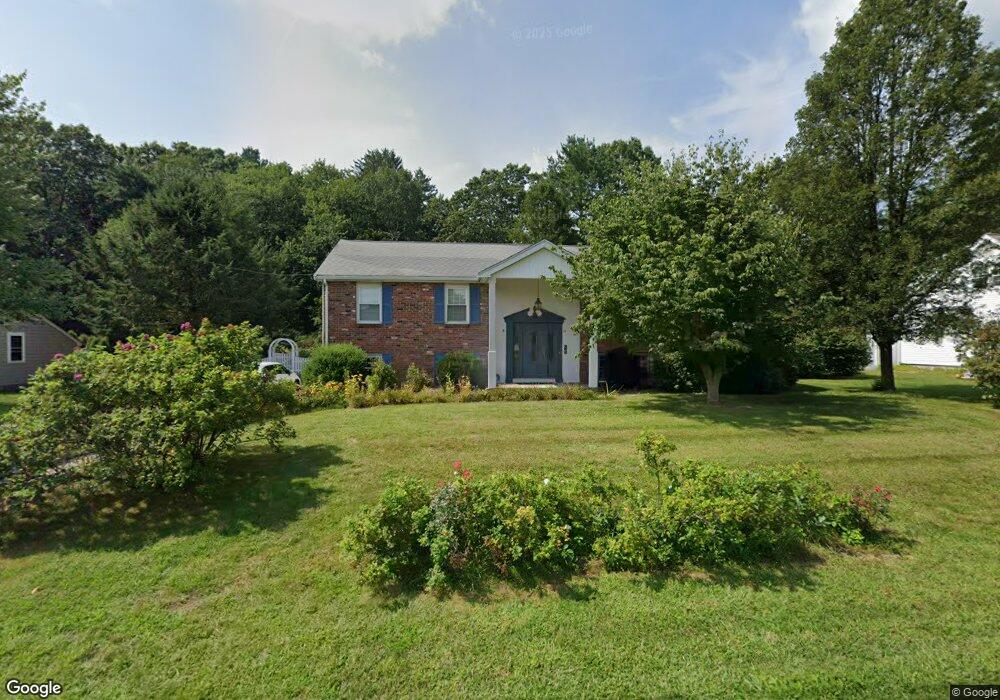
5 Colt Rd Franklin, MA 02038
Wadsworth NeighborhoodEstimated Value: $555,630 - $758,000
3
Beds
2
Baths
1,170
Sq Ft
$535/Sq Ft
Est. Value
About This Home
This home is located at 5 Colt Rd, Franklin, MA 02038 and is currently estimated at $625,908, approximately $534 per square foot. 5 Colt Rd is a home located in Norfolk County with nearby schools including Jefferson Elementary School, Remington Middle School, and Franklin High School.
Ownership History
Date
Name
Owned For
Owner Type
Purchase Details
Closed on
Mar 19, 2018
Sold by
Milne Jeffrey J and Milne Joyce L
Bought by
Jeffrey J Milne 2018 Ft
Current Estimated Value
Purchase Details
Closed on
Jul 25, 1990
Sold by
Dena Robert S
Bought by
Milne Jeffrey J
Create a Home Valuation Report for This Property
The Home Valuation Report is an in-depth analysis detailing your home's value as well as a comparison with similar homes in the area
Home Values in the Area
Average Home Value in this Area
Purchase History
| Date | Buyer | Sale Price | Title Company |
|---|---|---|---|
| Jeffrey J Milne 2018 Ft | -- | None Available | |
| Milne Jeffrey J | $169,900 | -- |
Source: Public Records
Mortgage History
| Date | Status | Borrower | Loan Amount |
|---|---|---|---|
| Previous Owner | Milne Jeffrey J | $50,000 | |
| Previous Owner | Milne Jeffrey J | $199,000 | |
| Previous Owner | Milne Jeffrey J | $49,500 |
Source: Public Records
Tax History
| Year | Tax Paid | Tax Assessment Tax Assessment Total Assessment is a certain percentage of the fair market value that is determined by local assessors to be the total taxable value of land and additions on the property. | Land | Improvement |
|---|---|---|---|---|
| 2025 | $6,654 | $572,600 | $243,100 | $329,500 |
| 2024 | $6,369 | $540,200 | $243,100 | $297,100 |
| 2023 | $6,201 | $492,900 | $253,600 | $239,300 |
| 2022 | $5,925 | $421,700 | $209,500 | $212,200 |
| 2021 | $5,429 | $370,600 | $205,500 | $165,100 |
| 2020 | $5,489 | $378,300 | $220,800 | $157,500 |
| 2019 | $5,235 | $357,100 | $199,700 | $157,400 |
| 2018 | $5,149 | $351,500 | $209,300 | $142,200 |
| 2017 | $4,873 | $334,200 | $192,000 | $142,200 |
| 2016 | $4,755 | $327,900 | $204,900 | $123,000 |
| 2015 | $4,511 | $304,000 | $181,000 | $123,000 |
| 2014 | $4,235 | $293,100 | $170,800 | $122,300 |
Source: Public Records
Map
Nearby Homes
- 1 Spring St
- 18 Bubbling Brook Rd
- 900 Washington St Lot 2
- 241 Prospect St
- 9 Reagan Ave
- 925 Washington St
- 352 Lake St
- 99 Stone Ridge Rd
- 1 Washington St
- 3 Washington St
- 374-378 Union St
- 640 Maple Brook Rd
- 10 Follett Dr
- 1501 Old Bridge Ln Unit 1501
- 0 Fall Ln
- 9 Brookfield Ln
- 1620 West St
- 3003 Maple Brook Rd Unit 3003
- 139 King St Unit 306
- 163 W Central St
Your Personal Tour Guide
Ask me questions while you tour the home.