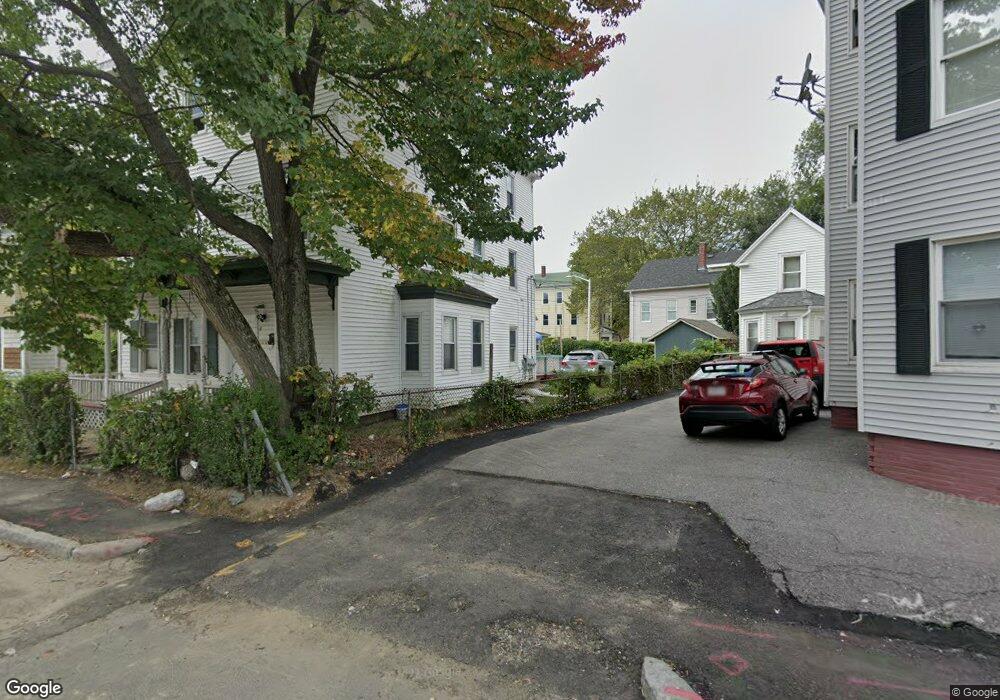
5 Douglas Ct Worcester, MA 01603
South Worcester NeighborhoodEstimated Value: $259,000 - $287,000
2
Beds
1
Bath
1,038
Sq Ft
$268/Sq Ft
Est. Value
About This Home
This home is located at 5 Douglas Ct, Worcester, MA 01603 and is currently estimated at $277,906, approximately $267 per square foot. 5 Douglas Ct is a home located in Worcester County with nearby schools including Jacob Hiatt Magnet School, Chandler Magnet, and University Park Campus School.
Ownership History
Date
Name
Owned For
Owner Type
Purchase Details
Closed on
Jun 18, 2010
Sold by
Sears Mark R
Bought by
Rodriguez Luz
Current Estimated Value
Home Financials for this Owner
Home Financials are based on the most recent Mortgage that was taken out on this home.
Original Mortgage
$103,604
Outstanding Balance
$71,216
Interest Rate
5.5%
Mortgage Type
FHA
Estimated Equity
$206,690
Purchase Details
Closed on
May 31, 2006
Sold by
Chase Home Fin Llc
Bought by
Sears Mark R
Purchase Details
Closed on
Dec 22, 1999
Sold by
Picard Steven R
Bought by
Garay Miguel A and Klebart Darleen
Home Financials for this Owner
Home Financials are based on the most recent Mortgage that was taken out on this home.
Original Mortgage
$66,300
Interest Rate
7.61%
Mortgage Type
Purchase Money Mortgage
Create a Home Valuation Report for This Property
The Home Valuation Report is an in-depth analysis detailing your home's value as well as a comparison with similar homes in the area
Home Values in the Area
Average Home Value in this Area
Purchase History
| Date | Buyer | Sale Price | Title Company |
|---|---|---|---|
| Rodriguez Luz | $105,000 | -- | |
| Sears Mark R | $135,750 | -- | |
| Garay Miguel A | $66,900 | -- |
Source: Public Records
Mortgage History
| Date | Status | Borrower | Loan Amount |
|---|---|---|---|
| Open | Rodriguez Luz | $103,604 | |
| Previous Owner | Garay Miguel A | $2,972 | |
| Previous Owner | Garay Miguel A | $11,098 | |
| Previous Owner | Garay Miguel A | $10,468 | |
| Previous Owner | Garay Miguel A | $66,300 |
Source: Public Records
Tax History
| Year | Tax Paid | Tax Assessment Tax Assessment Total Assessment is a certain percentage of the fair market value that is determined by local assessors to be the total taxable value of land and additions on the property. | Land | Improvement |
|---|---|---|---|---|
| 2025 | $2,383 | $180,700 | $64,800 | $115,900 |
| 2024 | $2,305 | $167,600 | $64,800 | $102,800 |
| 2023 | $2,132 | $148,700 | $51,200 | $97,500 |
| 2022 | $1,962 | $129,000 | $41,000 | $88,000 |
| 2021 | $1,991 | $122,300 | $32,800 | $89,500 |
| 2020 | $1,907 | $112,200 | $32,800 | $79,400 |
| 2019 | $1,946 | $108,100 | $31,200 | $76,900 |
| 2018 | $1,948 | $103,000 | $31,200 | $71,800 |
| 2017 | $1,839 | $95,700 | $31,200 | $64,500 |
| 2016 | $1,824 | $88,500 | $21,500 | $67,000 |
| 2015 | $1,776 | $88,500 | $21,500 | $67,000 |
| 2014 | $1,729 | $88,500 | $21,500 | $67,000 |
Source: Public Records
Map
Nearby Homes
- 95 Douglas Ct
- 3 Douglas Ct
- 9 Douglas Ct
- 9 Douglas Ct Unit 1
- 28 Douglas St Unit 1
- 28 Douglas St Unit 3
- 24 Douglas St
- 24 Douglas St Unit 2
- 24 Douglas St Unit 3
- 17 Camp St
- 22 Douglas St
- 22 Douglas St Unit 1
- 9 1/2 Douglas Ct
- 9 1/2 Douglas Ct
- 19 Camp St
- 15 Camp St
- 18 Douglas St
- 6 Douglas Ct
- 13 Camp St
- 26 Douglas St
Your Personal Tour Guide
Ask me questions while you tour the home.