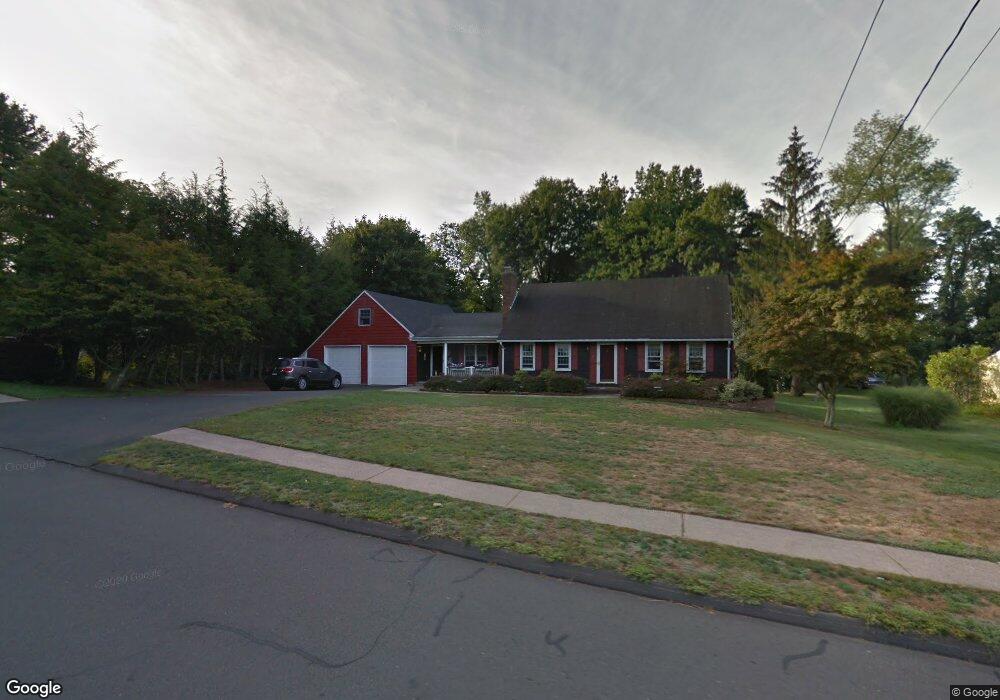
5 Nutmeg Ave Enfield, CT 06082
Estimated Value: $241,696 - $309,000
2
Beds
2
Baths
1,170
Sq Ft
$241/Sq Ft
Est. Value
About This Home
This home is located at 5 Nutmeg Ave, Enfield, CT 06082 and is currently estimated at $281,674, approximately $240 per square foot. 5 Nutmeg Ave is a home located in Hartford County with nearby schools including Enfield Street Elementary School, Edgar H. Parkman School, and Enfield High School.
Ownership History
Date
Name
Owned For
Owner Type
Purchase Details
Closed on
Jul 31, 2009
Sold by
Griffin Christine
Bought by
Nai Edward
Current Estimated Value
Home Financials for this Owner
Home Financials are based on the most recent Mortgage that was taken out on this home.
Original Mortgage
$166,500
Outstanding Balance
$109,771
Interest Rate
5.43%
Mortgage Type
Purchase Money Mortgage
Estimated Equity
$171,903
Purchase Details
Closed on
Jun 29, 2007
Sold by
Vavolakis James
Bought by
Griffin Christine
Home Financials for this Owner
Home Financials are based on the most recent Mortgage that was taken out on this home.
Original Mortgage
$139,120
Interest Rate
6.24%
Mortgage Type
Purchase Money Mortgage
Purchase Details
Closed on
Apr 12, 2001
Sold by
Staples Katherine and Staples Robie
Bought by
Vavolakis James
Home Financials for this Owner
Home Financials are based on the most recent Mortgage that was taken out on this home.
Original Mortgage
$92,650
Interest Rate
6.97%
Mortgage Type
Purchase Money Mortgage
Create a Home Valuation Report for This Property
The Home Valuation Report is an in-depth analysis detailing your home's value as well as a comparison with similar homes in the area
Home Values in the Area
Average Home Value in this Area
Purchase History
| Date | Buyer | Sale Price | Title Company |
|---|---|---|---|
| Nai Edward | $169,600 | -- | |
| Griffin Christine | $173,900 | -- | |
| Vavolakis James | $109,000 | -- |
Source: Public Records
Mortgage History
| Date | Status | Borrower | Loan Amount |
|---|---|---|---|
| Open | Vavolakis James | $166,500 | |
| Previous Owner | Vavolakis James | $139,120 | |
| Previous Owner | Vavolakis James | $20,085 | |
| Previous Owner | Vavolakis James | $92,650 |
Source: Public Records
Tax History
| Year | Tax Paid | Tax Assessment Tax Assessment Total Assessment is a certain percentage of the fair market value that is determined by local assessors to be the total taxable value of land and additions on the property. | Land | Improvement |
|---|---|---|---|---|
| 2025 | $3,544 | $101,300 | $0 | $101,300 |
| 2024 | $3,449 | $101,300 | $0 | $101,300 |
| 2023 | $3,424 | $101,300 | $0 | $101,300 |
| 2022 | $3,109 | $101,300 | $0 | $101,300 |
| 2021 | $3,442 | $91,710 | $0 | $91,710 |
| 2020 | $3,442 | $91,710 | $0 | $91,710 |
| 2019 | $3,451 | $91,710 | $0 | $91,710 |
| 2018 | $3,393 | $91,710 | $0 | $91,710 |
| 2017 | $3,203 | $91,710 | $0 | $91,710 |
| 2016 | $3,247 | $94,650 | $0 | $94,650 |
| 2015 | $3,146 | $94,650 | $0 | $94,650 |
| 2014 | $3,065 | $94,650 | $0 | $94,650 |
Source: Public Records
Map
Nearby Homes
- 270 Pearl St
- 11 Orchard Hill Dr
- 242 Pearl St
- 1.5 Bridge Ln
- 5 Claremont Ave
- 47 Maple Ave
- 2 Pearl Street Extension
- 69 Prospect St
- 41 Walnut St
- 80 S River St
- 24 Ohear Ave
- 24 Pebblestone Cir Unit 24
- 147 W Grayling Ln
- 4 Pebblestone Cir
- 51 Barrett Rd
- 3 Pebblestone Cir Unit 3
- 57 Asnuntuck St
- 15 Summer St
- 92 Post Office Rd
- 40 Church St
- 7 Nutmeg Village
- 7 Nutmeg Ave
- 3 Nutmeg Village
- 3 Nutmeg Ave
- 2 Nutmeg Village
- 2 Nutmeg Ave
- 9 Nutmeg Ave
- 4 Nutmeg Village
- 4 Nutmeg Village Unit 4
- 4 Nutmeg Village Unit 1D
- 4 Nutmeg Ave Unit 1D
- 4 Nutmeg Village Unit D
- 9 Nutmeg Ave
- 6 Nutmeg Village
- 6 Nutmeg Ave
- 10 Green Valley Dr
- 8 Green Valley Dr
- 8 Nutmeg Ave
- 1236 Enfield St
- 11 Nutmeg Village
Your Personal Tour Guide
Ask me questions while you tour the home.