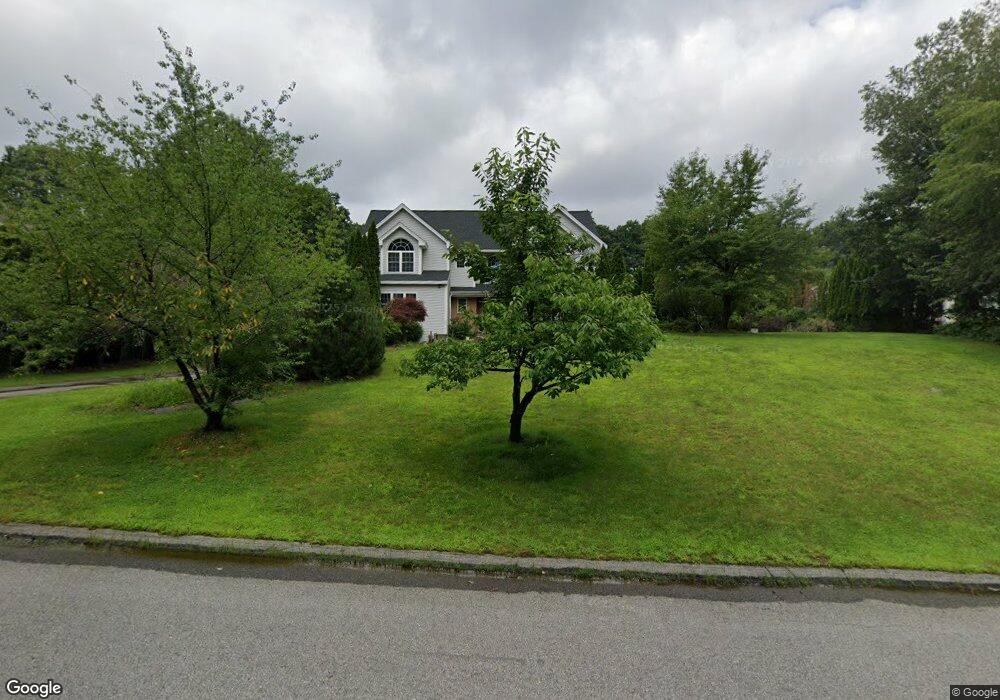
5 Osgood St Unit 1 Windham, NH 03087
Estimated Value: $1,114,988 - $1,289,000
4
Beds
3
Baths
3,400
Sq Ft
$355/Sq Ft
Est. Value
About This Home
This home is located at 5 Osgood St Unit 1, Windham, NH 03087 and is currently estimated at $1,206,497, approximately $354 per square foot. 5 Osgood St Unit 1 is a home located in Rockingham County with nearby schools including Golden Brook Elementary School, Windham Middle School, and Windham High School.
Ownership History
Date
Name
Owned For
Owner Type
Purchase Details
Closed on
Oct 4, 2019
Sold by
Holdings David and Holding Coleen
Bought by
Ayer Chadani and Upadhayay Umesh R
Current Estimated Value
Home Financials for this Owner
Home Financials are based on the most recent Mortgage that was taken out on this home.
Original Mortgage
$633,139
Outstanding Balance
$565,458
Interest Rate
4.5%
Mortgage Type
FHA
Estimated Equity
$641,039
Purchase Details
Closed on
Jul 16, 2013
Sold by
Paul E Geary Lt and Geary Paul E
Bought by
Holding David and Holding Coleen
Purchase Details
Closed on
Jul 10, 2001
Sold by
Gauthier Yvan R and Gauthier Lucie F
Bought by
Geary Paul E
Home Financials for this Owner
Home Financials are based on the most recent Mortgage that was taken out on this home.
Original Mortgage
$390,000
Interest Rate
7.21%
Purchase Details
Closed on
Nov 8, 1999
Sold by
Cjm Excavating & Dev C
Bought by
Gauthier Yvan R
Create a Home Valuation Report for This Property
The Home Valuation Report is an in-depth analysis detailing your home's value as well as a comparison with similar homes in the area
Home Values in the Area
Average Home Value in this Area
Purchase History
| Date | Buyer | Sale Price | Title Company |
|---|---|---|---|
| Ayer Chadani | $655,000 | -- | |
| Holding David | $415,000 | -- | |
| Geary Paul E | $490,000 | -- | |
| Gauthier Yvan R | $125,000 | -- |
Source: Public Records
Mortgage History
| Date | Status | Borrower | Loan Amount |
|---|---|---|---|
| Open | Ayer Chadani | $633,139 | |
| Previous Owner | Gauthier Yvan R | $200,000 | |
| Previous Owner | Gauthier Yvan R | $390,000 |
Source: Public Records
Tax History Compared to Growth
Tax History
| Year | Tax Paid | Tax Assessment Tax Assessment Total Assessment is a certain percentage of the fair market value that is determined by local assessors to be the total taxable value of land and additions on the property. | Land | Improvement |
|---|---|---|---|---|
| 2024 | $14,449 | $638,200 | $201,200 | $437,000 |
| 2023 | $13,657 | $638,200 | $201,200 | $437,000 |
| 2022 | $12,575 | $636,400 | $201,200 | $435,200 |
| 2021 | $11,850 | $636,400 | $201,200 | $435,200 |
| 2020 | $4,761 | $636,400 | $201,200 | $435,200 |
| 2019 | $11,636 | $516,000 | $184,600 | $331,400 |
| 2018 | $9,957 | $516,000 | $184,600 | $331,400 |
| 2017 | $10,318 | $510,800 | $184,600 | $326,200 |
| 2016 | $10,934 | $501,100 | $184,600 | $316,500 |
| 2015 | $10,884 | $501,100 | $184,600 | $316,500 |
| 2014 | $11,227 | $467,800 | $195,000 | $272,800 |
| 2013 | $11,264 | $477,300 | $195,000 | $282,300 |
Source: Public Records
Map
Nearby Homes