Estimated Value: $595,000 - $753,000
3
Beds
2
Baths
1,536
Sq Ft
$441/Sq Ft
Est. Value
About This Home
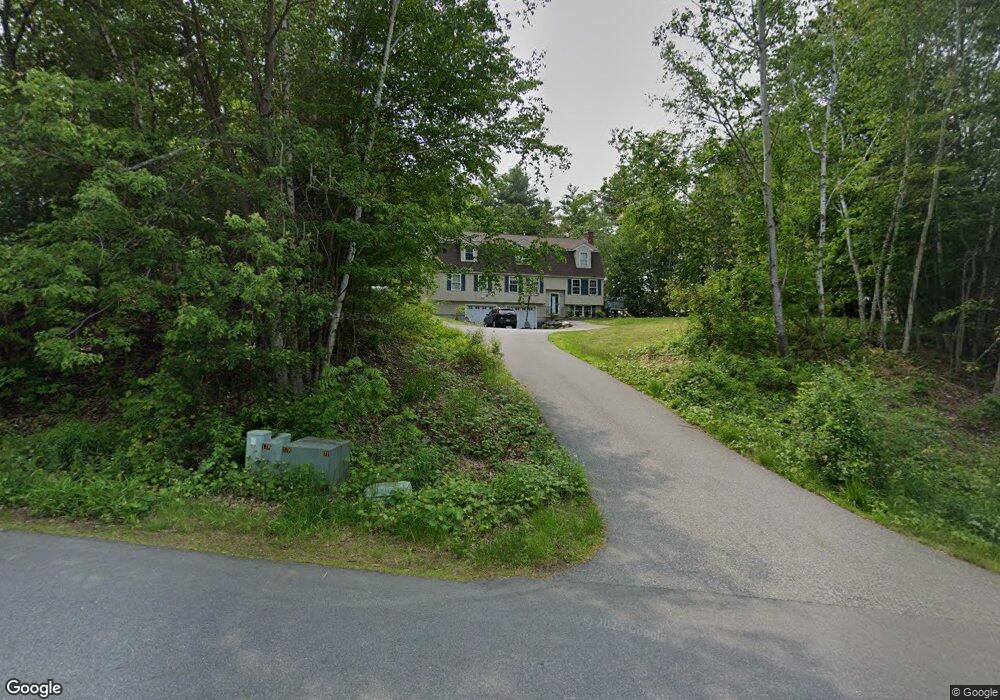
This home is located at 5 Pemigewasset Cir, Derry, NH 03038 and is currently estimated at $677,901, approximately $441 per square foot. 5 Pemigewasset Cir is a home located in Rockingham County with nearby schools including Derry Village School, West Running Brook Middle School, and Pinkerton Academy.
Ownership History
Date
Name
Owned For
Owner Type
Purchase Details
Closed on
Apr 16, 2004
Sold by
Greenwood Jonathan M and Greenwood Kristin C
Bought by
Reimer James M and Reimer Nichole C
Current Estimated Value
Home Financials for this Owner
Home Financials are based on the most recent Mortgage that was taken out on this home.
Original Mortgage
$200,000
Outstanding Balance
$93,592
Interest Rate
5.58%
Mortgage Type
Purchase Money Mortgage
Estimated Equity
$584,309
Purchase Details
Closed on
Nov 16, 2000
Sold by
Jamieson Martha
Bought by
Greenwood Jonathan M and Greenwood Kristin C
Home Financials for this Owner
Home Financials are based on the most recent Mortgage that was taken out on this home.
Original Mortgage
$151,920
Interest Rate
7.78%
Purchase Details
Closed on
Jul 15, 1997
Sold by
Jrv Homes Inc
Bought by
Jamieson Martha
Home Financials for this Owner
Home Financials are based on the most recent Mortgage that was taken out on this home.
Original Mortgage
$119,100
Interest Rate
7.86%
Create a Home Valuation Report for This Property
The Home Valuation Report is an in-depth analysis detailing your home's value as well as a comparison with similar homes in the area
Home Values in the Area
Average Home Value in this Area
Purchase History
| Date | Buyer | Sale Price | Title Company |
|---|---|---|---|
| Reimer James M | $263,000 | -- | |
| Greenwood Jonathan M | $189,900 | -- | |
| Jamieson Martha | $125,500 | -- |
Source: Public Records
Mortgage History
| Date | Status | Borrower | Loan Amount |
|---|---|---|---|
| Open | Jamieson Martha | $200,000 | |
| Previous Owner | Jamieson Martha | $151,920 | |
| Previous Owner | Jamieson Martha | $119,100 |
Source: Public Records
Tax History Compared to Growth
Tax History
| Year | Tax Paid | Tax Assessment Tax Assessment Total Assessment is a certain percentage of the fair market value that is determined by local assessors to be the total taxable value of land and additions on the property. | Land | Improvement |
|---|---|---|---|---|
| 2024 | $12,027 | $643,500 | $0 | $643,500 |
| 2023 | $10,934 | $528,700 | $0 | $528,700 |
| 2022 | $9,981 | $524,200 | $0 | $524,200 |
| 2021 | $10,171 | $410,800 | $0 | $410,800 |
| 2020 | $9,999 | $410,800 | $0 | $410,800 |
| 2019 | $8,633 | $330,500 | $86,000 | $244,500 |
| 2018 | $6,461 | $248,200 | $86,000 | $162,200 |
| 2017 | $6,999 | $242,500 | $86,000 | $156,500 |
| 2016 | $6,562 | $242,500 | $86,000 | $156,500 |
| 2015 | $6,390 | $218,600 | $86,000 | $132,600 |
| 2014 | $6,431 | $218,600 | $86,000 | $132,600 |
| 2013 | $6,440 | $204,500 | $86,000 | $118,500 |
Source: Public Records
Map
Nearby Homes
- 242 Rockingham Rd
- 24 Alyssa Dr
- 22 Jacob Rd
- 5A Homestead Dr Unit A
- 5A Homestead Dr
- 87 Island Pond Rd
- 2 Kinsman Ln
- 7 Evergreen Way
- 26 Partridge Rd
- 44 Hadleigh Rd
- 3 Evergreen Way
- 13 Craven Terrace
- 29 Hawk Dr
- 16 Autumn Woods Rd
- 24 Rockingham Rd
- 35 Steele Rd
- 41 Trails Edge Rd
- 44 Trails Edge Rd
- 2 Brown Rd
- 139 Rockingham Rd Unit 21
- 7 Pemigewasset Cir
- 3 Pemigewasset Cir
- 9 Pemigewasset Cir
- 2 Squamscott Ave
- 1 Pemigewasset Cir
- 6 Pemigewasset Cir
- 10 Pemigewasset Cir
- 11 Pemigewasset Cir
- 4 Squamscott Ave
- 13 Pemigewasset Cir
- 2 Pemigewasset Cir
- 8 Pemigewasset Cir
- 4 Pemigewasset Cir
- 14 Pemigewasset Cir
- 6 Squamscott Ave
- 1 Squamscott Ave
- 46 Kilrea Rd
- 12 Pemigewasset Cir
- 48 Kilrea Rd
- 15 Pemigewasset Cir