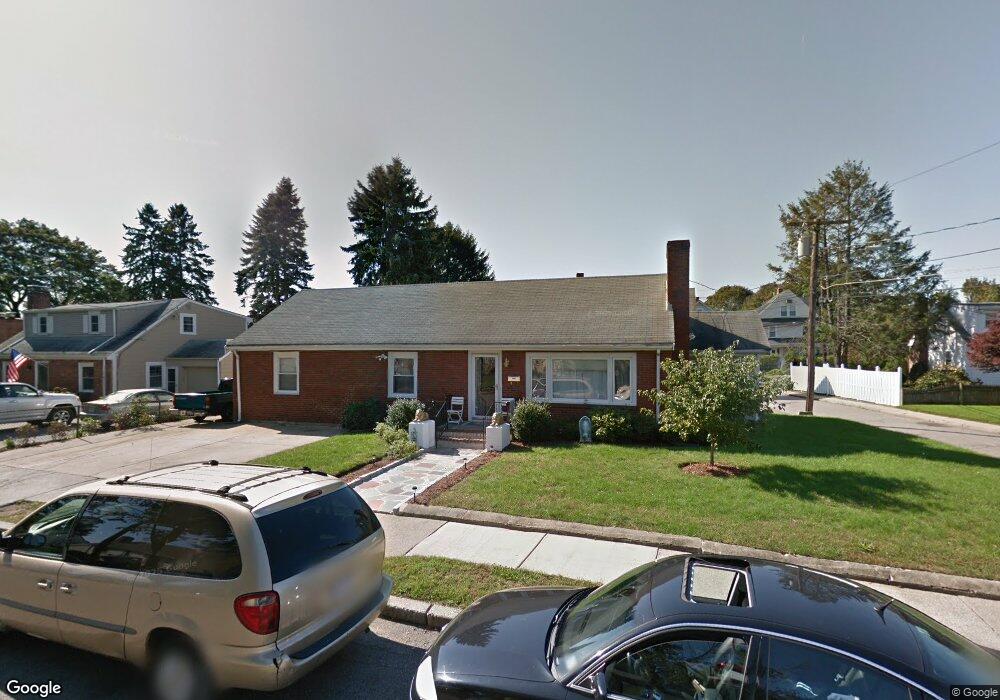
5 Rose Dr Unit 1 West Newton, MA 02465
West Newton NeighborhoodEstimated Value: $1,166,374 - $1,271,000
3
Beds
1
Bath
1,300
Sq Ft
$931/Sq Ft
Est. Value
About This Home
This home is located at 5 Rose Dr Unit 1, West Newton, MA 02465 and is currently estimated at $1,210,094, approximately $930 per square foot. 5 Rose Dr Unit 1 is a home located in Middlesex County with nearby schools including C.C. Burr, Franklin Elementary School, and F.A. Day Middle School.
Ownership History
Date
Name
Owned For
Owner Type
Purchase Details
Closed on
Feb 14, 2018
Sold by
Caruso Vittorio and Nicolazzo Rosa
Bought by
Nicolazzo Eugenio and Amira Alison
Current Estimated Value
Home Financials for this Owner
Home Financials are based on the most recent Mortgage that was taken out on this home.
Original Mortgage
$550,000
Outstanding Balance
$465,332
Interest Rate
3.95%
Mortgage Type
New Conventional
Estimated Equity
$744,762
Purchase Details
Closed on
Aug 12, 2016
Sold by
Nicolazzo Rosa
Bought by
Nicolazzo Pasquale and Nicolazzo Rosa
Home Financials for this Owner
Home Financials are based on the most recent Mortgage that was taken out on this home.
Original Mortgage
$200,000
Interest Rate
3.48%
Mortgage Type
New Conventional
Purchase Details
Closed on
Apr 24, 2013
Sold by
Caruso Nicoletta
Bought by
Caruso Juan and Nicolazzo Rosa
Purchase Details
Closed on
Oct 18, 1991
Sold by
Margaret Mountz Est
Bought by
Gerrity Melissa D
Create a Home Valuation Report for This Property
The Home Valuation Report is an in-depth analysis detailing your home's value as well as a comparison with similar homes in the area
Home Values in the Area
Average Home Value in this Area
Purchase History
| Date | Buyer | Sale Price | Title Company |
|---|---|---|---|
| Nicolazzo Eugenio | $687,500 | -- | |
| Nicolazzo Pasquale | -- | -- | |
| Nicolazzo Rosa | $300,000 | -- | |
| Caruso Juan | -- | -- | |
| Gerrity Melissa D | $33,000 | -- |
Source: Public Records
Mortgage History
| Date | Status | Borrower | Loan Amount |
|---|---|---|---|
| Open | Nicolazzo Eugenio | $550,000 | |
| Previous Owner | Nicolazzo Rosa | $200,000 | |
| Previous Owner | Gerrity Melissa D | $57,550 |
Source: Public Records
Tax History Compared to Growth
Tax History
| Year | Tax Paid | Tax Assessment Tax Assessment Total Assessment is a certain percentage of the fair market value that is determined by local assessors to be the total taxable value of land and additions on the property. | Land | Improvement |
|---|---|---|---|---|
| 2025 | $9,752 | $995,100 | $729,200 | $265,900 |
| 2024 | $9,429 | $966,100 | $708,000 | $258,100 |
| 2023 | $8,818 | $866,200 | $530,000 | $336,200 |
| 2022 | $8,437 | $802,000 | $490,700 | $311,300 |
| 2021 | $8,141 | $756,600 | $462,900 | $293,700 |
| 2020 | $6,990 | $669,500 | $462,900 | $206,600 |
| 2019 | $6,413 | $613,700 | $449,400 | $164,300 |
| 2018 | $9,564 | $561,000 | $408,800 | $152,200 |
| 2017 | $5,885 | $529,200 | $385,700 | $143,500 |
| 2016 | $5,629 | $494,600 | $360,500 | $134,100 |
| 2015 | $5,366 | $462,200 | $336,900 | $125,300 |
Source: Public Records
Map
Nearby Homes
- 56 Dearborn St
- 212 River St Unit 2
- 44 Westland Ave
- 265-267 River St Unit 267
- 265-267 River St Unit 265
- 33 Lill Ave
- 14 Cottage Place Unit 14
- 90 Auburndale Ave
- 106 River St Unit 18
- 106 River St Unit 2
- 106 River St Unit 14
- 287 Cherry St Unit 2
- 2 Elm St Unit 6
- 2 Elm St Unit 8
- 334 River St
- 41 Kilburn Rd
- 371 Cherry St
- 101-103 Lexington St
- 53-55 N Gate Park
- 160 Pine St Unit 12