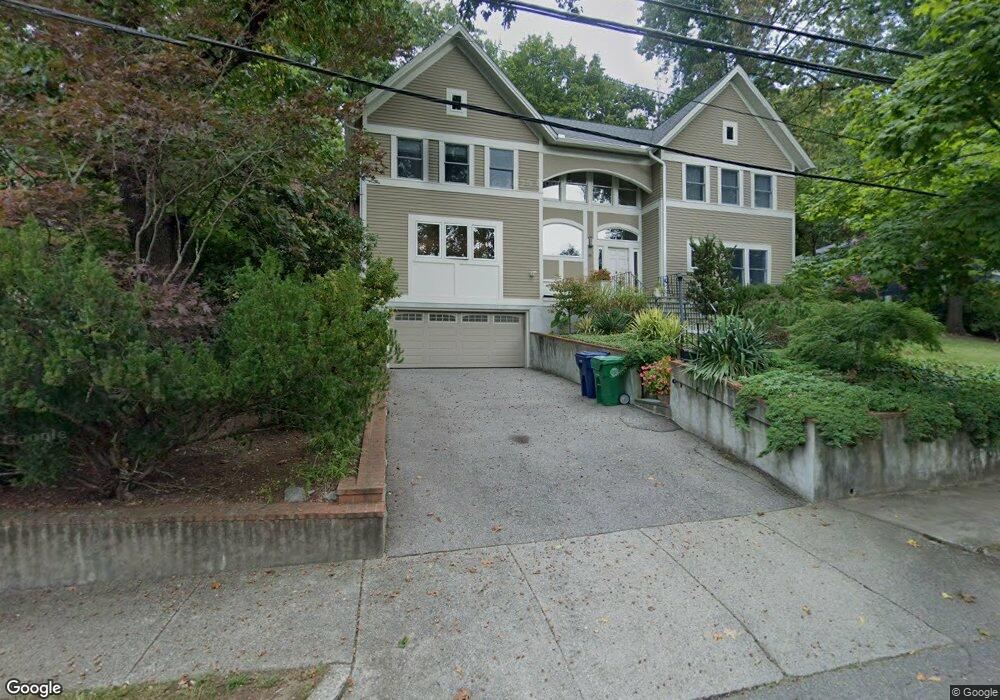
50 Pontiac Rd Waban, MA 02468
Waban NeighborhoodEstimated Value: $1,732,000 - $2,524,000
4
Beds
5
Baths
3,327
Sq Ft
$653/Sq Ft
Est. Value
About This Home
This home is located at 50 Pontiac Rd, Waban, MA 02468 and is currently estimated at $2,173,443, approximately $653 per square foot. 50 Pontiac Rd is a home located in Middlesex County with nearby schools including Angier Elementary School, Charles E Brown Middle School, and Newton South High School.
Ownership History
Date
Name
Owned For
Owner Type
Purchase Details
Closed on
Jun 18, 1997
Sold by
Kaplun Boris and Kaplun Lubov
Bought by
Kipman Yair and Kipman Daphna E
Current Estimated Value
Purchase Details
Closed on
Feb 2, 1987
Sold by
Friedlander Ellen B
Bought by
Kaplum Boris
Create a Home Valuation Report for This Property
The Home Valuation Report is an in-depth analysis detailing your home's value as well as a comparison with similar homes in the area
Home Values in the Area
Average Home Value in this Area
Purchase History
| Date | Buyer | Sale Price | Title Company |
|---|---|---|---|
| Kipman Yair | $375,000 | -- | |
| Kaplum Boris | $290,000 | -- |
Source: Public Records
Mortgage History
| Date | Status | Borrower | Loan Amount |
|---|---|---|---|
| Open | Kaplum Boris | $250,000 | |
| Closed | Kaplum Boris | $275,000 | |
| Closed | Kaplum Boris | $297,000 |
Source: Public Records
Tax History Compared to Growth
Tax History
| Year | Tax Paid | Tax Assessment Tax Assessment Total Assessment is a certain percentage of the fair market value that is determined by local assessors to be the total taxable value of land and additions on the property. | Land | Improvement |
|---|---|---|---|---|
| 2025 | $21,863 | $2,230,900 | $1,296,900 | $934,000 |
| 2024 | $21,139 | $2,165,900 | $1,259,100 | $906,800 |
| 2023 | $20,307 | $1,994,800 | $969,200 | $1,025,600 |
| 2022 | $19,186 | $1,823,800 | $897,400 | $926,400 |
| 2021 | $18,514 | $1,720,600 | $846,600 | $874,000 |
| 2020 | $17,963 | $1,720,600 | $846,600 | $874,000 |
| 2019 | $17,457 | $1,670,500 | $821,900 | $848,600 |
| 2018 | $17,183 | $1,588,100 | $754,500 | $833,600 |
| 2017 | $16,660 | $1,498,200 | $711,800 | $786,400 |
| 2016 | $15,934 | $1,400,200 | $665,200 | $735,000 |
| 2015 | $15,193 | $1,308,600 | $621,700 | $686,900 |
Source: Public Records
Map
Nearby Homes
- 177 Varick Rd
- 34 Palmer Rd
- 45 E Quinobequin Rd
- 34 Pilgrim Rd
- 1801 Beacon St
- 10 Lorraine Cir
- 33 Metacomet Rd
- 2084 Washington St
- 6 Willow St
- 18 Annawan Rd
- 45 Moulton St
- 120 Collins Rd
- 20 Kinmonth Rd Unit 203
- 20 Kinmonth Rd Unit 306
- 206 Cedar St
- 10 Fife Rd
- 181 Saint Mary St
- 187 Saint Mary St
- 115 Windsor Rd
- 7 Crescent St