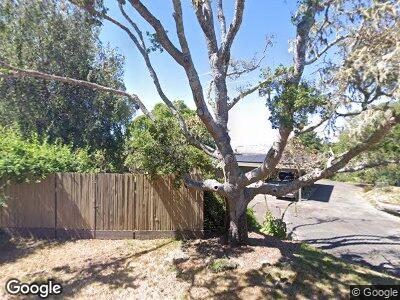
50 Rannoch Way Inverness, CA 94937
Estimated Value: $1,313,000 - $2,121,000
3
Beds
2
Baths
1,968
Sq Ft
$860/Sq Ft
Est. Value
About This Home
This home is located at 50 Rannoch Way, Inverness, CA 94937 and is currently estimated at $1,693,225, approximately $860 per square foot. 50 Rannoch Way is a home with nearby schools including West Marin Elementary School and Tomales High School.
Ownership History
Date
Name
Owned For
Owner Type
Purchase Details
Closed on
Apr 21, 2008
Sold by
Read James Birkland and Read Abbie Ann
Bought by
Read James B and Read Abbie Ann
Current Estimated Value
Purchase Details
Closed on
Nov 6, 2002
Sold by
Read Abbie Ann
Bought by
Read Abbie Ann
Create a Home Valuation Report for This Property
The Home Valuation Report is an in-depth analysis detailing your home's value as well as a comparison with similar homes in the area
Home Values in the Area
Average Home Value in this Area
Purchase History
| Date | Buyer | Sale Price | Title Company |
|---|---|---|---|
| Read James B | -- | None Available | |
| Read Abbie Ann | -- | -- |
Source: Public Records
Tax History Compared to Growth
Tax History
| Year | Tax Paid | Tax Assessment Tax Assessment Total Assessment is a certain percentage of the fair market value that is determined by local assessors to be the total taxable value of land and additions on the property. | Land | Improvement |
|---|---|---|---|---|
| 2024 | $4,389 | $206,955 | $101,744 | $105,211 |
| 2023 | $4,308 | $202,897 | $99,749 | $103,148 |
| 2022 | $4,273 | $198,919 | $97,793 | $101,126 |
| 2021 | $4,218 | $195,020 | $95,876 | $99,144 |
| 2020 | $4,216 | $193,020 | $94,893 | $98,127 |
| 2019 | $3,756 | $189,236 | $93,033 | $96,203 |
| 2018 | $2,510 | $185,526 | $91,209 | $94,317 |
| 2017 | $2,452 | $181,889 | $89,421 | $92,468 |
| 2016 | $2,346 | $178,322 | $87,667 | $90,655 |
| 2015 | $2,337 | $175,645 | $86,351 | $89,294 |
| 2014 | $2,243 | $172,205 | $84,660 | $87,545 |
Source: Public Records
Map
Nearby Homes
- 330 Aberdeen Way
- 4 Pine Hill Dr
- 500 Aberdeen Way
- 100 Edgemont Way
- 71 Inverness Way
- 95 Highland Way
- 11 Inverness Way
- 620 Via de la Vista
- 0 W Robert Dr
- 1 Dover Rd
- 1208 Pierce Point Rd
- 65 Kyleswood Place
- 41 Cypress Rd
- 10905 State Route 1
- 70 Fox Dr
- 10950 Highway 1
- 1 Dillon Beach Rd
- 200 Road To Ranch
- 1401 Nicasio Valley Rd
- 533 Wilson Hill Rd