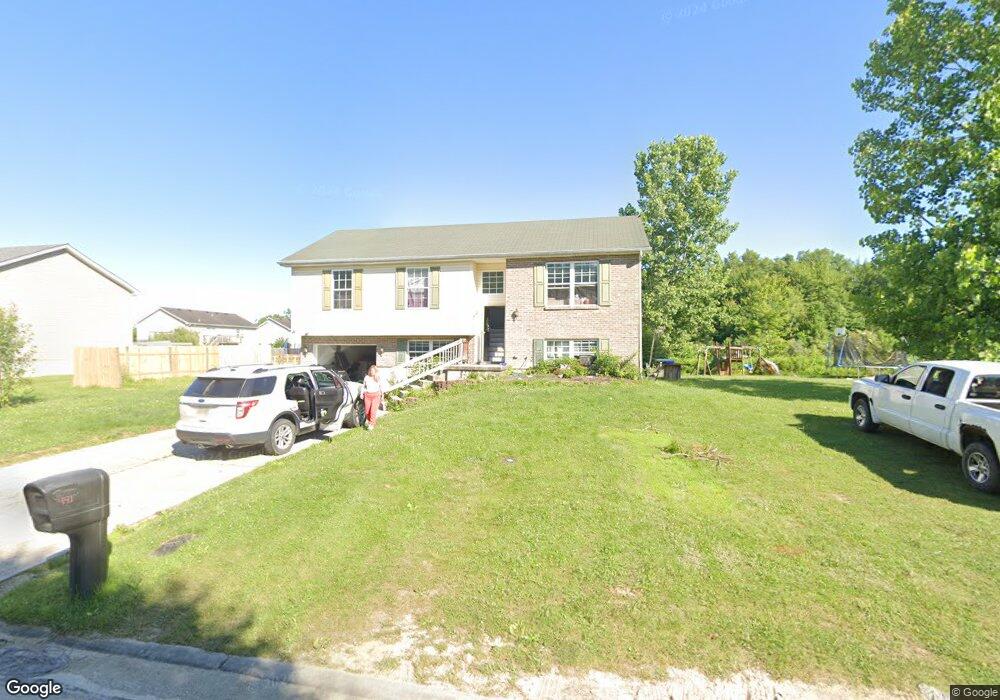
500 Day Rd Mount Orab, OH 45154
Estimated Value: $476,992
3
Beds
1
Bath
1,025
Sq Ft
$465/Sq Ft
Est. Value
About This Home
This home is located at 500 Day Rd, Mount Orab, OH 45154 and is currently estimated at $476,992, approximately $465 per square foot. 500 Day Rd is a home located in Brown County with nearby schools including Western Brown High School.
Ownership History
Date
Name
Owned For
Owner Type
Purchase Details
Closed on
Oct 1, 2021
Sold by
Gorman Raymond E and Gorman Raymond E
Bought by
Mt Orab Sports Complex Llc
Current Estimated Value
Purchase Details
Closed on
Apr 21, 2017
Sold by
Gorman Raymond E
Bought by
Mt Orab Port Authority
Purchase Details
Closed on
Jan 17, 2017
Sold by
Gorman Ray and Gorman Rhea A
Bought by
Gorman Raymond E and Raymond E Gorman And Rhea Ann Gorman Fam
Purchase Details
Closed on
Dec 9, 2002
Sold by
Logsdon William R
Bought by
Gorman Raymond
Purchase Details
Closed on
Feb 21, 1996
Sold by
Jacobs Terry L
Bought by
Equal Housing Inc
Create a Home Valuation Report for This Property
The Home Valuation Report is an in-depth analysis detailing your home's value as well as a comparison with similar homes in the area
Home Values in the Area
Average Home Value in this Area
Purchase History
| Date | Buyer | Sale Price | Title Company |
|---|---|---|---|
| Mt Orab Sports Complex Llc | -- | None Available | |
| Mt Orab Port Authority | -- | None Available | |
| Gorman Raymond E | -- | None Available | |
| Gorman Raymond | $225,000 | -- | |
| Equal Housing Inc | $160,000 | -- |
Source: Public Records
Tax History
| Year | Tax Paid | Tax Assessment Tax Assessment Total Assessment is a certain percentage of the fair market value that is determined by local assessors to be the total taxable value of land and additions on the property. | Land | Improvement |
|---|---|---|---|---|
| 2024 | $243 | $6,300 | $6,300 | $0 |
| 2023 | $242 | $6,240 | $6,240 | $0 |
| 2022 | $215 | $6,240 | $6,240 | $0 |
| 2021 | $206 | $6,240 | $6,240 | $0 |
| 2020 | $1,064 | $30,520 | $5,200 | $25,320 |
| 2019 | $1,134 | $30,520 | $5,200 | $25,320 |
| 2018 | $1,122 | $30,520 | $5,200 | $25,320 |
| 2017 | $2,826 | $74,970 | $53,900 | $21,070 |
| 2016 | $2,827 | $74,970 | $53,900 | $21,070 |
| 2015 | $2,703 | $74,970 | $53,900 | $21,070 |
| 2014 | $2,583 | $70,070 | $49,000 | $21,070 |
| 2013 | $2,577 | $70,070 | $49,000 | $21,070 |
Source: Public Records
Map
Nearby Homes
- 317 Robin Ave
- 0 State Route 32 Unit 1795308
- 329 E Main St
- 102 Tom's Turnaround
- 402 E Main St
- 506 E Main St
- 203 Bingaman Ln
- 206 Bingaman Ln
- 3517 Bardwell Buford Rd
- 311 Smith Ave
- 108 Lonny St
- 106 Lonny St
- 102 Lonny St
- 4488 Bardwell Buford Rd
- 0 Donley Rd Unit 1859270
- 414 Castle Ave
- 110 Nathans Ln
- 106 Nathans Ln
- 105 Maple Ridge Ave
- 419 Liming Farm Rd
Your Personal Tour Guide
Ask me questions while you tour the home.