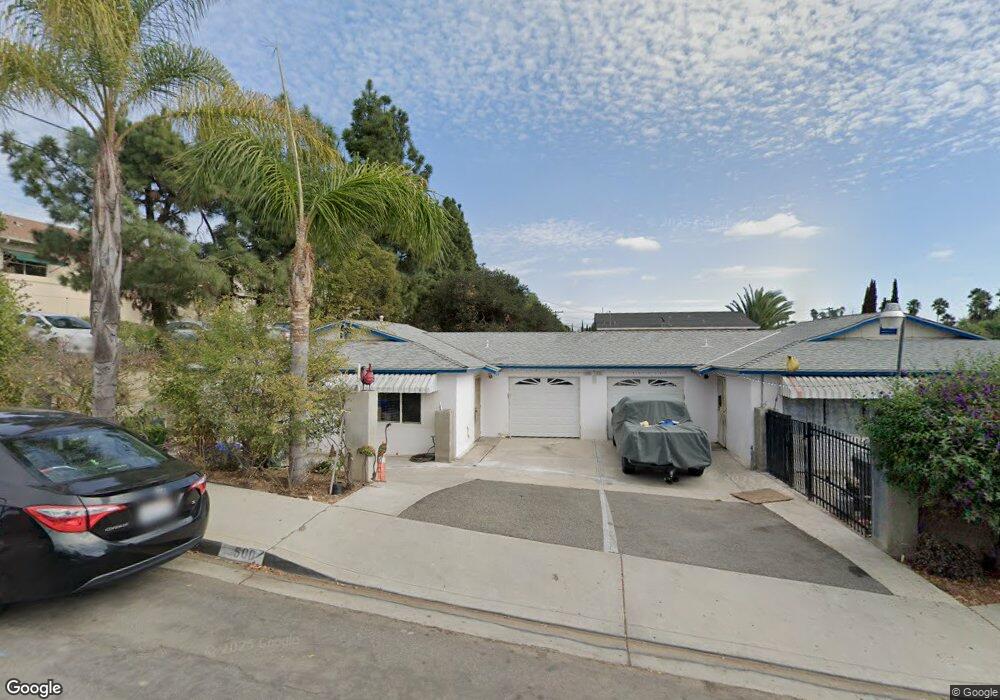
500 Elbrook Dr Unit 2 Fallbrook, CA 92028
Estimated Value: $768,078 - $911,000
4
Beds
2
Baths
1,736
Sq Ft
$478/Sq Ft
Est. Value
About This Home
This home is located at 500 Elbrook Dr Unit 2, Fallbrook, CA 92028 and is currently estimated at $829,026, approximately $477 per square foot. 500 Elbrook Dr Unit 2 is a home located in San Diego County with nearby schools including William H. Frazier Elementary School, James E. Potter Intermediate School, and Fallbrook High School.
Ownership History
Date
Name
Owned For
Owner Type
Purchase Details
Closed on
Mar 30, 2005
Sold by
Tomas Miguel
Bought by
Nolasco Tomas and Miguel Catalina Tomas
Current Estimated Value
Home Financials for this Owner
Home Financials are based on the most recent Mortgage that was taken out on this home.
Original Mortgage
$300,000
Outstanding Balance
$169,773
Interest Rate
7.3%
Mortgage Type
Unknown
Estimated Equity
$659,253
Purchase Details
Closed on
Feb 6, 2002
Sold by
Payne Leslie M and Payne Casandra J
Bought by
Tomas Tomas Nolasco and Tomas Catalina M
Home Financials for this Owner
Home Financials are based on the most recent Mortgage that was taken out on this home.
Original Mortgage
$192,283
Interest Rate
6.84%
Mortgage Type
FHA
Purchase Details
Closed on
Jun 16, 1989
Create a Home Valuation Report for This Property
The Home Valuation Report is an in-depth analysis detailing your home's value as well as a comparison with similar homes in the area
Home Values in the Area
Average Home Value in this Area
Purchase History
| Date | Buyer | Sale Price | Title Company |
|---|---|---|---|
| Nolasco Tomas | -- | First Southwestern Title Co | |
| Tomas Tomas Nolasco | $201,000 | Fidelity National Title | |
| -- | $140,000 | -- |
Source: Public Records
Mortgage History
| Date | Status | Borrower | Loan Amount |
|---|---|---|---|
| Open | Nolasco Tomas | $300,000 | |
| Previous Owner | Tomas Tomas Nolasco | $192,283 | |
| Closed | Tomas Tomas Nolasco | $11,700 |
Source: Public Records
Tax History
| Year | Tax Paid | Tax Assessment Tax Assessment Total Assessment is a certain percentage of the fair market value that is determined by local assessors to be the total taxable value of land and additions on the property. | Land | Improvement |
|---|---|---|---|---|
| 2025 | $4,335 | $417,854 | $220,774 | $197,080 |
| 2024 | $4,335 | $409,662 | $216,446 | $193,216 |
| 2023 | $4,210 | $401,630 | $212,202 | $189,428 |
| 2022 | $4,210 | $393,756 | $208,042 | $185,714 |
| 2021 | $4,077 | $386,036 | $203,963 | $182,073 |
| 2020 | $4,114 | $382,079 | $201,872 | $180,207 |
| 2019 | $4,038 | $374,588 | $197,914 | $176,674 |
| 2018 | $3,976 | $367,244 | $194,034 | $173,210 |
| 2017 | $3,897 | $360,044 | $190,230 | $169,814 |
| 2016 | $3,874 | $352,985 | $186,500 | $166,485 |
| 2015 | $3,799 | $347,684 | $183,699 | $163,985 |
| 2014 | $3,728 | $340,874 | $180,101 | $160,773 |
Source: Public Records
Map
Nearby Homes
- 508 Village View Place
- 502 E Elder St
- 210 S Orange Ave
- 522 S Pico Ave
- 741 Rossiter Ln
- 535 Shady Glen Dr
- 1024 Kiel Rd
- 0 Via Vonnie Unit SW26054903
- 868 E Alvarado St Unit 7
- 868 E Alvarado St Unit 47
- 408 N Pico Ave
- 214 Summit Ave
- 678 Robby Way
- 113 Gardenside Ct
- 956 Woodcreek Rd
- 206 Via Oro Verde
- 842 Porter Way
- 1003 Via Unidos
- 275 Royal Glen Dr
- 832 Magarian Rd
- 6035 Elbrook Dr
- 516 Twin Palm Cir
- 507 Twin Palm Cir
- 455 Elbrook Dr
- 445 Elbrook Dr
- 515 Twin Palm Cir
- 524 Elbrook Dr
- 522 Twin Palm Cir
- 435 Elbrook Dr
- 420 Woodcrest Ln
- 523 Elbrook Dr
- 425 Elbrook Dr
- 521 Twin Palm Cir
- 529 Elbrook Dr
- 503 Timber Feather Ln
- 416 Woodcrest Ln
- 531 Timber Feather Ln
- 519 Elbrook Dr
- 415 Elbrook Dr
- 565 Timber Feather Ln
Your Personal Tour Guide
Ask me questions while you tour the home.