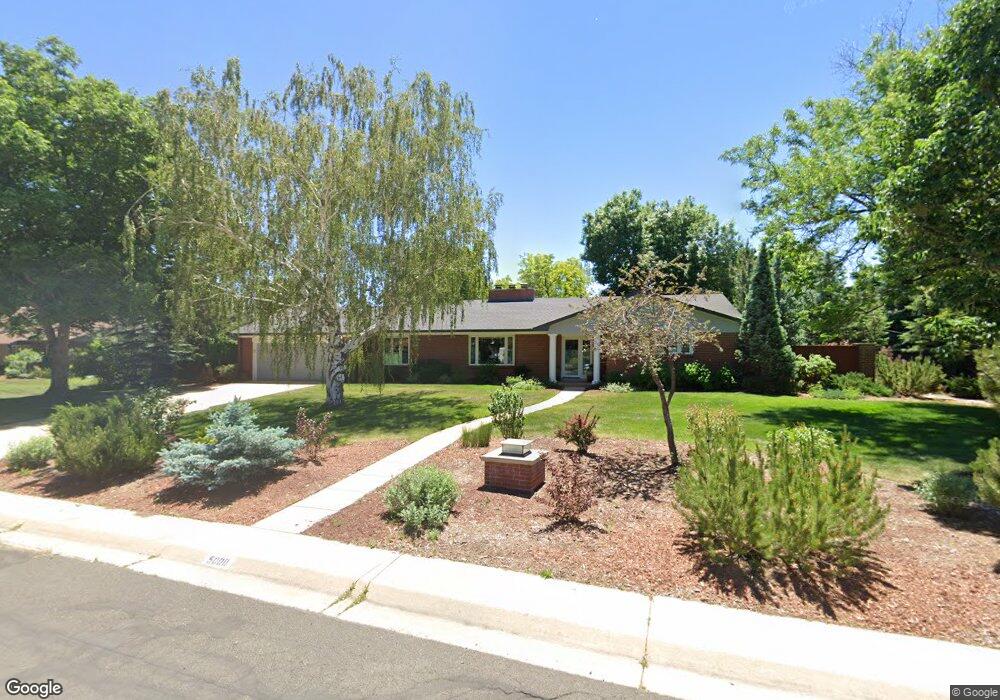
5000 Laurel Ave Boulder, CO 80303
Southeast Boulder NeighborhoodEstimated Value: $1,450,646 - $1,610,000
3
Beds
2
Baths
2,388
Sq Ft
$638/Sq Ft
Est. Value
About This Home
This home is located at 5000 Laurel Ave, Boulder, CO 80303 and is currently estimated at $1,523,912, approximately $638 per square foot. 5000 Laurel Ave is a home located in Boulder County with nearby schools including Eisenhower Elementary School, Manhattan Middle School of the Arts & Academics, and Fairview High School.
Ownership History
Date
Name
Owned For
Owner Type
Purchase Details
Closed on
Jul 13, 2007
Sold by
Hay John Thomas and Hammond Jeffrey Lee
Bought by
Hay John Thomas
Current Estimated Value
Home Financials for this Owner
Home Financials are based on the most recent Mortgage that was taken out on this home.
Original Mortgage
$525,000
Outstanding Balance
$328,827
Interest Rate
6.54%
Mortgage Type
New Conventional
Estimated Equity
$1,195,085
Purchase Details
Closed on
May 5, 1999
Sold by
Hegy Kenneth C and Estate Of Eleanor U Hegy
Bought by
Hay John Thomas
Home Financials for this Owner
Home Financials are based on the most recent Mortgage that was taken out on this home.
Original Mortgage
$300,000
Interest Rate
7.04%
Purchase Details
Closed on
Dec 11, 1978
Bought by
Hay John Thomas
Create a Home Valuation Report for This Property
The Home Valuation Report is an in-depth analysis detailing your home's value as well as a comparison with similar homes in the area
Home Values in the Area
Average Home Value in this Area
Purchase History
| Date | Buyer | Sale Price | Title Company |
|---|---|---|---|
| Hay John Thomas | -- | Landamerica | |
| Hay John Thomas | $375,000 | -- | |
| Hay John Thomas | -- | -- |
Source: Public Records
Mortgage History
| Date | Status | Borrower | Loan Amount |
|---|---|---|---|
| Open | Hay John Thomas | $525,000 | |
| Closed | Hay John Thomas | $300,000 |
Source: Public Records
Tax History
| Year | Tax Paid | Tax Assessment Tax Assessment Total Assessment is a certain percentage of the fair market value that is determined by local assessors to be the total taxable value of land and additions on the property. | Land | Improvement |
|---|---|---|---|---|
| 2025 | $7,398 | $82,125 | $60,281 | $21,844 |
| 2024 | $7,398 | $82,125 | $60,281 | $21,844 |
| 2023 | $7,270 | $90,879 | $69,613 | $24,951 |
| 2022 | $5,947 | $70,988 | $50,221 | $20,767 |
| 2021 | $5,671 | $73,030 | $51,666 | $21,364 |
| 2020 | $4,995 | $64,529 | $48,120 | $16,409 |
| 2019 | $4,918 | $64,529 | $48,120 | $16,409 |
| 2018 | $4,875 | $63,425 | $45,216 | $18,209 |
| 2017 | $4,722 | $70,120 | $49,989 | $20,131 |
| 2016 | $4,924 | $56,882 | $32,636 | $24,246 |
| 2015 | $4,663 | $46,749 | $26,268 | $20,481 |
| 2014 | $3,931 | $46,749 | $26,268 | $20,481 |
Source: Public Records
Map
Nearby Homes
- 816 Sycamore Ave
- 695 Manhattan Dr Unit 109
- 695 Manhattan Dr Unit 116
- 695 Manhattan Dr Unit 219
- 665 Manhattan Dr Unit 9
- 655 Cree Cir
- 5016 Forsythe Place
- 5550 Stonewall Place Unit 33
- 600 Manhattan Dr Unit A7
- 600 Manhattan Dr Unit C7
- 625 Manhattan Place Unit 308
- 875 Orman Dr
- 4500 Baseline Rd Unit 1208
- 5648 Baseline Rd
- 4475 Laguna Place Unit 206
- 4475 Laguna Place Unit 201
- 4415 Laguna Place Unit 201
- 4222 Monroe Dr Unit C
- 1180 Monroe Dr Unit B
- 4195 Chippewa Dr
- 911 Cypress Dr
- 5074 Laurel Ave
- 920 Crescent Dr
- 5105 Aurora Ave
- 910 Crescent Dr
- 903 Cypress Dr
- 940 Crescent Dr
- 5065 Laurel Ave
- 900 Crescent Dr
- 5073 Laurel Ave
- 893 Cypress Dr
- 5155 Aurora Ave
- 5150 Laurel Ave
- 5103 Laurel Ave
- 880 Crescent Dr
- 921 Crescent Dr
- 5144 Aurora Ave
- 911 Crescent Dr
- 873 Cypress Dr
- 980 Crescent Dr
Your Personal Tour Guide
Ask me questions while you tour the home.