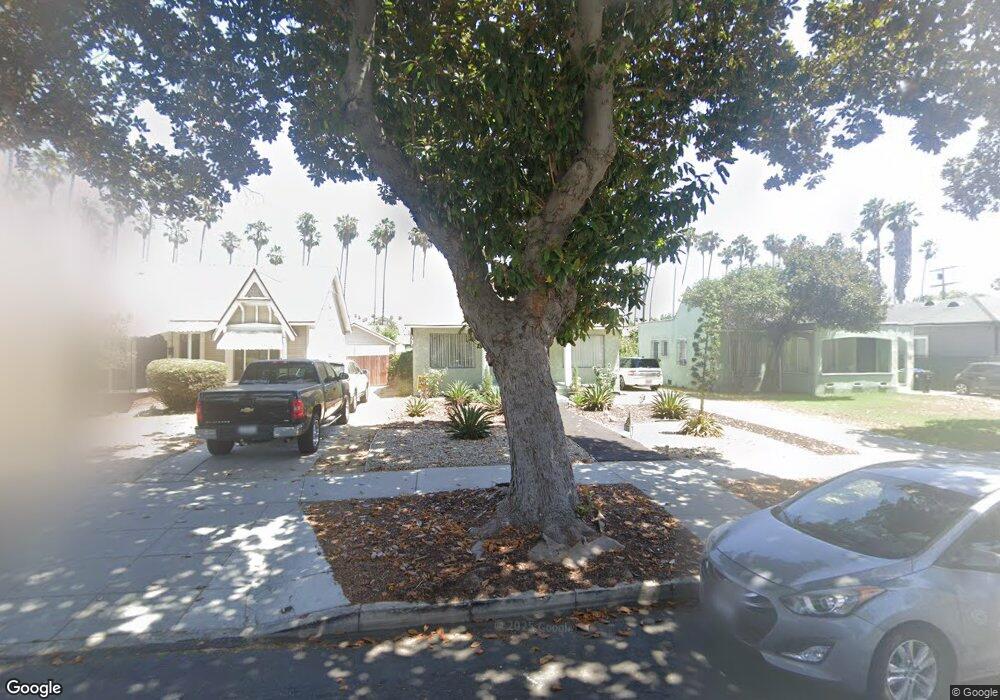
5012 7th Ave Los Angeles, CA 90043
Hyde Park NeighborhoodEstimated Value: $604,000 - $894,000
2
Beds
2
Baths
1,440
Sq Ft
$524/Sq Ft
Est. Value
About This Home
This home is located at 5012 7th Ave, Los Angeles, CA 90043 and is currently estimated at $754,562, approximately $524 per square foot. 5012 7th Ave is a home located in Los Angeles County with nearby schools including Angeles Mesa Elementary School, Audubon Middle School, and Crenshaw Science, Technology, Engineering, Math And Medicine Magnet.
Ownership History
Date
Name
Owned For
Owner Type
Purchase Details
Closed on
Jul 9, 1998
Sold by
Pryor Linda D
Bought by
Robertson Christopher and Robertson Sonya C
Current Estimated Value
Home Financials for this Owner
Home Financials are based on the most recent Mortgage that was taken out on this home.
Original Mortgage
$118,750
Outstanding Balance
$24,048
Interest Rate
6.88%
Estimated Equity
$730,514
Create a Home Valuation Report for This Property
The Home Valuation Report is an in-depth analysis detailing your home's value as well as a comparison with similar homes in the area
Home Values in the Area
Average Home Value in this Area
Purchase History
| Date | Buyer | Sale Price | Title Company |
|---|---|---|---|
| Robertson Christopher | $125,000 | Provident Title |
Source: Public Records
Mortgage History
| Date | Status | Borrower | Loan Amount |
|---|---|---|---|
| Open | Robertson Christopher | $118,750 |
Source: Public Records
Tax History
| Year | Tax Paid | Tax Assessment Tax Assessment Total Assessment is a certain percentage of the fair market value that is determined by local assessors to be the total taxable value of land and additions on the property. | Land | Improvement |
|---|---|---|---|---|
| 2025 | $2,540 | $195,938 | $150,642 | $45,296 |
| 2024 | $2,540 | $192,097 | $147,689 | $44,408 |
| 2023 | $2,498 | $188,332 | $144,794 | $43,538 |
| 2022 | $2,392 | $184,640 | $141,955 | $42,685 |
| 2021 | $2,353 | $181,021 | $139,172 | $41,849 |
| 2019 | $2,286 | $175,653 | $135,045 | $40,608 |
| 2018 | $2,193 | $172,210 | $132,398 | $39,812 |
| 2016 | $2,085 | $165,524 | $127,257 | $38,267 |
| 2015 | $2,056 | $163,039 | $125,346 | $37,693 |
| 2014 | $2,072 | $159,846 | $122,891 | $36,955 |
Source: Public Records
Map
Nearby Homes
Your Personal Tour Guide
Ask me questions while you tour the home.