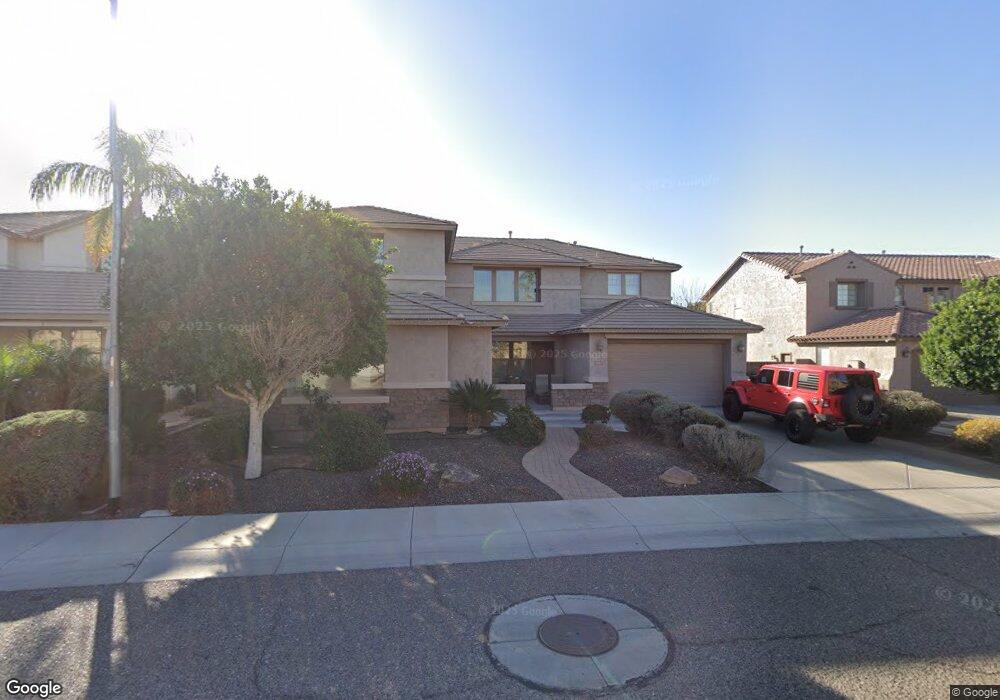
5017 W Rowel Rd Phoenix, AZ 85083
Stetson Valley NeighborhoodEstimated Value: $755,243 - $862,000
5
Beds
5
Baths
3,937
Sq Ft
$209/Sq Ft
Est. Value
About This Home
This home is located at 5017 W Rowel Rd, Phoenix, AZ 85083 and is currently estimated at $822,561, approximately $208 per square foot. 5017 W Rowel Rd is a home located in Maricopa County with nearby schools including Sandra Day O'connor High School, Hillcrest Middle School, and Bayer Private School.
Ownership History
Date
Name
Owned For
Owner Type
Purchase Details
Closed on
Feb 5, 2019
Sold by
Chung Sarah S
Bought by
Woo Ryan J and Atlantis Group Llc
Current Estimated Value
Purchase Details
Closed on
Aug 23, 2006
Sold by
Pulte Home Corp
Bought by
Chung Sarah S
Home Financials for this Owner
Home Financials are based on the most recent Mortgage that was taken out on this home.
Original Mortgage
$282,654
Interest Rate
6%
Mortgage Type
New Conventional
Purchase Details
Closed on
Aug 22, 2006
Sold by
Bae Donhwan
Bought by
Chung Sarah S
Home Financials for this Owner
Home Financials are based on the most recent Mortgage that was taken out on this home.
Original Mortgage
$282,654
Interest Rate
6%
Mortgage Type
New Conventional
Purchase Details
Closed on
Dec 7, 2005
Sold by
Stetson Venture Ii Llc
Bought by
Pulte Home Corp
Create a Home Valuation Report for This Property
The Home Valuation Report is an in-depth analysis detailing your home's value as well as a comparison with similar homes in the area
Home Values in the Area
Average Home Value in this Area
Purchase History
| Date | Buyer | Sale Price | Title Company |
|---|---|---|---|
| Woo Ryan J | $500,000 | None Available | |
| Chung Sarah S | $532,654 | Sun Title Agency Co | |
| Chung Sarah S | -- | Sun Title Agency Co | |
| Pulte Home Corp | $4,305,860 | Title Security Agency Of Az |
Source: Public Records
Mortgage History
| Date | Status | Borrower | Loan Amount |
|---|---|---|---|
| Previous Owner | Chung Sarah S | $282,654 | |
| Previous Owner | Chung Sarah S | $282,654 |
Source: Public Records
Tax History
| Year | Tax Paid | Tax Assessment Tax Assessment Total Assessment is a certain percentage of the fair market value that is determined by local assessors to be the total taxable value of land and additions on the property. | Land | Improvement |
|---|---|---|---|---|
| 2025 | $3,769 | $45,022 | -- | -- |
| 2024 | $4,486 | $42,878 | -- | -- |
| 2023 | $4,486 | $55,760 | $11,150 | $44,610 |
| 2022 | $4,335 | $42,660 | $8,530 | $34,130 |
| 2021 | $4,450 | $40,670 | $8,130 | $32,540 |
| 2020 | $4,373 | $38,760 | $7,750 | $31,010 |
| 2019 | $4,247 | $38,080 | $7,610 | $30,470 |
| 2018 | $3,519 | $37,560 | $7,510 | $30,050 |
| 2017 | $3,398 | $35,980 | $7,190 | $28,790 |
| 2016 | $3,206 | $40,550 | $8,110 | $32,440 |
| 2015 | $2,862 | $41,130 | $8,220 | $32,910 |
Source: Public Records
Map
Nearby Homes
- 5021 W Rowel Rd
- 3310 W Jomax Rd
- 4929 W Marcus Dr
- 26708 N Babbling Brook Dr
- 5354 W Chisum Trail Unit 183
- 26212 N 54th Ave
- 5374 W Chisum Trail Unit 179
- 25919 N 54th Ave Unit 143
- 5253 W Maya Way
- 5022 W El Cortez Trail
- 5111 W Cavedale Dr
- 5510 W Tether Trail
- 5513 W Rowel Rd
- 5126 W Bajada Rd
- 26216 N 56th Dr
- 5455 W Bajada Rd
- 5639 W Bonanza Ln
- 5148 W Quail Track Dr
- 5423 W Range Mule Dr
- 5005 W Range Mule Dr
- 5013 W Rowel Rd
- 5010 W Tether Trail
- 5006 W Tether Trail
- 5014 W Tether Trail
- 5009 W Rowel Rd
- 5016 W Rowel Rd
- 4950 W Tether Trail
- 5020 W Rowel Rd
- 5012 W Rowel Rd
- 4945 W Rowel Rd
- 4946 W Tether Trail
- 26318 N 50th Dr
- 26314 N 50th Dr
- 26310 N 50th Dr
- 5024 W Rowel Rd
- 26306 N 50th Dr
- 26215 N 50th Dr
- 4941 W Rowel Rd
- 26220 N 50th Dr
- 5007 W Jomax Rd
Your Personal Tour Guide
Ask me questions while you tour the home.