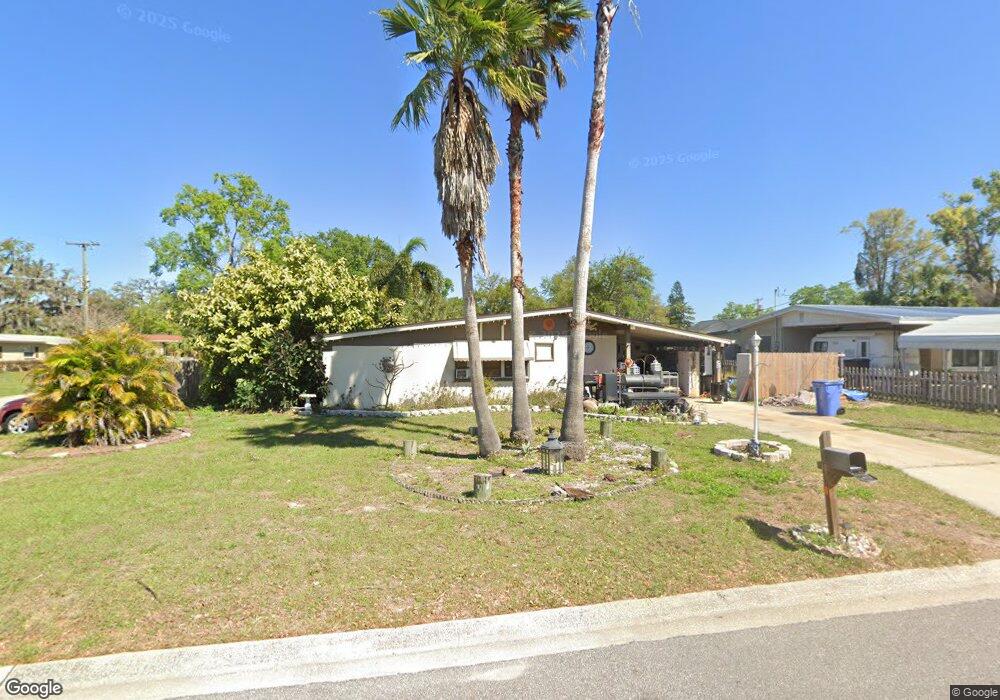
502 Hedge Row Rd Brandon, FL 33510
Estimated Value: $271,000 - $289,000
3
Beds
2
Baths
1,815
Sq Ft
$153/Sq Ft
Est. Value
About This Home
This home is located at 502 Hedge Row Rd, Brandon, FL 33510 and is currently estimated at $276,904, approximately $152 per square foot. 502 Hedge Row Rd is a home located in Hillsborough County with nearby schools including Yates Elementary School, Mann Middle School, and Brandon High School.
Ownership History
Date
Name
Owned For
Owner Type
Purchase Details
Closed on
Apr 22, 2011
Sold by
Jacobsen Kevin and Cooper Jacobsen Angela
Bought by
Kroll James T
Current Estimated Value
Home Financials for this Owner
Home Financials are based on the most recent Mortgage that was taken out on this home.
Original Mortgage
$51,656
Outstanding Balance
$35,037
Interest Rate
4.75%
Mortgage Type
FHA
Estimated Equity
$241,867
Purchase Details
Closed on
Nov 17, 2006
Sold by
Abdian Ruthelia Q
Bought by
Jacobsen Kevin
Home Financials for this Owner
Home Financials are based on the most recent Mortgage that was taken out on this home.
Original Mortgage
$143,925
Interest Rate
9.44%
Mortgage Type
Unknown
Purchase Details
Closed on
Jan 19, 2005
Sold by
King Donna Lee
Bought by
Abdian Ruthelia Q
Home Financials for this Owner
Home Financials are based on the most recent Mortgage that was taken out on this home.
Original Mortgage
$123,210
Interest Rate
6.37%
Mortgage Type
Unknown
Create a Home Valuation Report for This Property
The Home Valuation Report is an in-depth analysis detailing your home's value as well as a comparison with similar homes in the area
Home Values in the Area
Average Home Value in this Area
Purchase History
| Date | Buyer | Sale Price | Title Company |
|---|---|---|---|
| Kroll James T | $53,000 | Riverview Title & Escrow Svc | |
| Jacobsen Kevin | $151,000 | All American Title | |
| Abdian Ruthelia Q | $136,900 | Linsky & Reiber Real Estate |
Source: Public Records
Mortgage History
| Date | Status | Borrower | Loan Amount |
|---|---|---|---|
| Open | Kroll James T | $51,656 | |
| Previous Owner | Jacobsen Kevin | $143,925 | |
| Previous Owner | Abdian Ruthelia Q | $123,210 |
Source: Public Records
Tax History
| Year | Tax Paid | Tax Assessment Tax Assessment Total Assessment is a certain percentage of the fair market value that is determined by local assessors to be the total taxable value of land and additions on the property. | Land | Improvement |
|---|---|---|---|---|
| 2025 | $1,101 | $71,153 | -- | -- |
| 2024 | $1,101 | $69,148 | -- | -- |
| 2023 | $1,051 | $67,134 | $0 | $0 |
| 2022 | $955 | $65,179 | $0 | $0 |
| 2021 | $954 | $63,281 | $0 | $0 |
| 2020 | $891 | $62,407 | $0 | $0 |
| 2019 | $834 | $61,004 | $0 | $0 |
| 2018 | $798 | $59,867 | $0 | $0 |
| 2017 | $791 | $90,573 | $0 | $0 |
| 2016 | $781 | $57,430 | $0 | $0 |
| 2015 | $790 | $57,031 | $0 | $0 |
| 2014 | $773 | $56,578 | $0 | $0 |
| 2013 | -- | $55,742 | $0 | $0 |
Source: Public Records
Map
Nearby Homes
- 606 S Sylvan Dr
- 908 Skyview Dr
- 115 Morrow Cir
- 702 Valley Hill Dr
- 522 Hilldale Rd
- 310 Terrace Dr
- 1052 Malletwood Dr
- 603 Oak Ridge Dr
- 613 Valley Hill Dr
- 809 Rollingwood Ln
- 707 Rollingwood Ln
- 209 Clemons Rd
- 1301 Vinemont Dr
- 1305 Willow Valley Dr
- 505 Seffner Valrico Rd
- 500 Hillpine Way
- 1017 Ridgefield Dr
- 1114 Classic Dr
- 618 Rollingwood Ln
- 3509 King George Ln
- 504 Hedge Row Rd
- 501 N Everina Cir
- 503 N Everina Cir
- 718 W Everina Cir
- 716 W Everina Cir
- 501 Hedge Row Rd
- 506 Hedge Row Rd
- 720 W Everina Cir
- 503 Hedge Row Rd
- 505 N Everina Cir
- 505 Hedge Row Rd
- 722 W Everina Cir
- 508 Hedge Row Rd
- 712 W Everina Cir
- 507 N Everina Cir
- 501 Holly Ln
- 504 N Everina Cir
- 503 Holly Ln
- 506 N Everina Cir
- 507 Hedge Row Rd
Your Personal Tour Guide
Ask me questions while you tour the home.