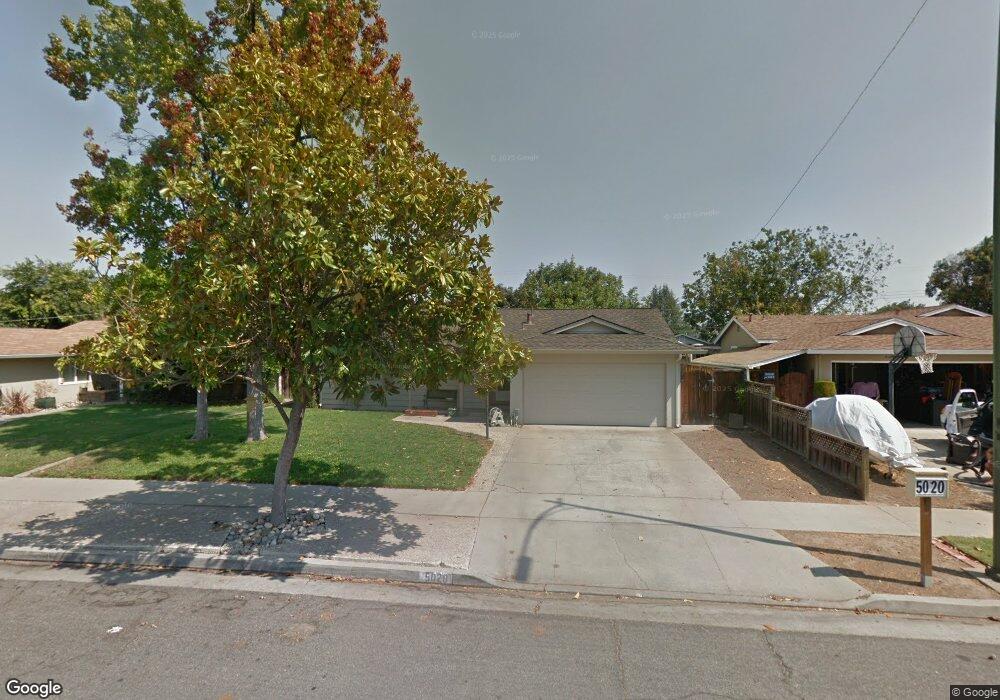
5020 Tifton Way San Jose, CA 95118
Valley View-Reed NeighborhoodEstimated Value: $1,523,000 - $1,659,000
4
Beds
2
Baths
1,408
Sq Ft
$1,123/Sq Ft
Est. Value
About This Home
This home is located at 5020 Tifton Way, San Jose, CA 95118 and is currently estimated at $1,581,651, approximately $1,123 per square foot. 5020 Tifton Way is a home located in Santa Clara County with nearby schools including Almaden Elementary School, John Muir Middle School, and Pioneer High School.
Ownership History
Date
Name
Owned For
Owner Type
Purchase Details
Closed on
Aug 30, 2017
Sold by
English David M
Bought by
English David M
Current Estimated Value
Purchase Details
Closed on
May 16, 2001
Sold by
English David M and English Janet I
Bought by
English David M
Home Financials for this Owner
Home Financials are based on the most recent Mortgage that was taken out on this home.
Original Mortgage
$275,000
Outstanding Balance
$102,685
Interest Rate
7.03%
Estimated Equity
$1,478,966
Purchase Details
Closed on
Nov 23, 1993
Sold by
English David M and English Janet L
Bought by
English David M and English Janet L
Home Financials for this Owner
Home Financials are based on the most recent Mortgage that was taken out on this home.
Original Mortgage
$80,000
Interest Rate
6.74%
Create a Home Valuation Report for This Property
The Home Valuation Report is an in-depth analysis detailing your home's value as well as a comparison with similar homes in the area
Home Values in the Area
Average Home Value in this Area
Purchase History
| Date | Buyer | Sale Price | Title Company |
|---|---|---|---|
| English David M | -- | None Available | |
| English David M | -- | Alliance Title Company | |
| English David M | -- | North American Title Co Inc |
Source: Public Records
Mortgage History
| Date | Status | Borrower | Loan Amount |
|---|---|---|---|
| Open | English David M | $275,000 | |
| Closed | English David M | $80,000 |
Source: Public Records
Tax History Compared to Growth
Tax History
| Year | Tax Paid | Tax Assessment Tax Assessment Total Assessment is a certain percentage of the fair market value that is determined by local assessors to be the total taxable value of land and additions on the property. | Land | Improvement |
|---|---|---|---|---|
| 2025 | $3,996 | $149,433 | $43,457 | $105,976 |
| 2024 | $3,996 | $146,504 | $42,605 | $103,899 |
| 2023 | $3,867 | $143,632 | $41,770 | $101,862 |
| 2022 | $3,803 | $140,816 | $40,951 | $99,865 |
| 2021 | $3,636 | $138,056 | $40,149 | $97,907 |
| 2020 | $3,443 | $136,642 | $39,738 | $96,904 |
| 2019 | $3,315 | $133,963 | $38,959 | $95,004 |
| 2018 | $3,242 | $131,338 | $38,196 | $93,142 |
| 2017 | $3,193 | $128,764 | $37,448 | $91,316 |
| 2016 | $3,043 | $126,240 | $36,714 | $89,526 |
| 2015 | $3,010 | $124,345 | $36,163 | $88,182 |
| 2014 | $2,153 | $121,910 | $35,455 | $86,455 |
Source: Public Records
Map
Nearby Homes
- 5092 Trenary Way
- 1264 Bouret Dr Unit 4
- 1359 Shawn Dr Unit 4
- 1372 Branham Ln Unit 1
- 1448 Luning Dr
- 1448 Lansing Ave
- 1155 Illiad Ct
- 5454 Russo Dr
- 1398 Boysea Dr
- 1126 Cherryview Ln
- 1115 Odyssey Ct
- 5321 Garwood Dr
- 4570 Waterville Dr
- 4450 Silva Ave
- 4519 Waterville Dr
- 4501 Waterville Dr
- 5559 Russo Dr
- 5400 Southbridge Ct
- 4460 Lahaina Way
- 1299 Foxwood Dr
- 5028 Tifton Way
- 5012 Tifton Way
- 5033 Corbin Ave
- 5039 Corbin Ave
- 5004 Tifton Way
- 5036 Tifton Way
- 5027 Corbin Ave
- 5045 Corbin Ave
- 5015 Tifton Way
- 5025 Tifton Way
- 5021 Corbin Ave
- 5051 Corbin Ave
- 5044 Tifton Way
- 5009 Tifton Way
- 4998 Tifton Way
- 5035 Tifton Way
- 5001 Tifton Way
- 5015 Corbin Ave
- 5057 Corbin Ave
- 5052 Tifton Way