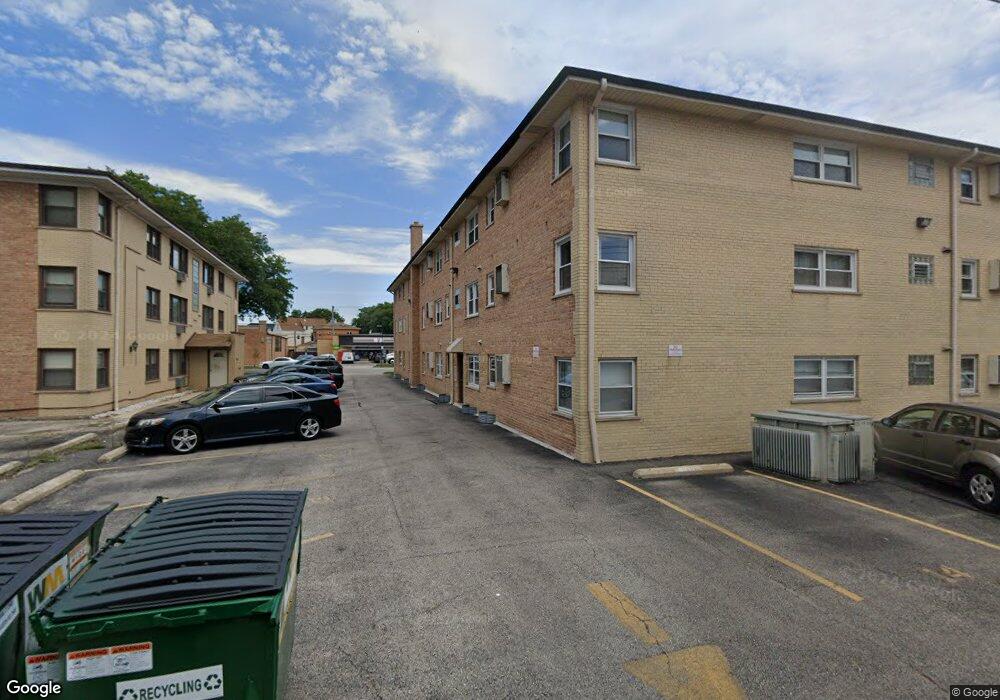
5026 N Austin Ave Unit 1D Chicago, IL 60630
Jefferson Park NeighborhoodEstimated Value: $158,000 - $240,000
--
Bed
--
Bath
--
Sq Ft
0.63
Acres
About This Home
This home is located at 5026 N Austin Ave Unit 1D, Chicago, IL 60630 and is currently estimated at $206,960. 5026 N Austin Ave Unit 1D is a home located in Cook County with nearby schools including Prussing Elementary School, William Howard Taft High School, and St. Constance School.
Ownership History
Date
Name
Owned For
Owner Type
Purchase Details
Closed on
Nov 6, 2019
Sold by
Farfaras Aristidis
Bought by
Farfaras Aristidis and The Aristidis Farfaras Revocable Trust
Current Estimated Value
Purchase Details
Closed on
Jul 10, 2002
Sold by
Farfaras Jennifer E
Bought by
Declaration Farfaras Eugenia J and Eugenia J Farfaras Declaration Of Trust
Purchase Details
Closed on
Jul 13, 1998
Sold by
Wojcik Daniel
Bought by
Farfaras Jennifer E
Home Financials for this Owner
Home Financials are based on the most recent Mortgage that was taken out on this home.
Original Mortgage
$95,000
Interest Rate
6.83%
Purchase Details
Closed on
Jun 5, 1995
Sold by
Chicago Title & Trust Company
Bought by
Wojcik Helen
Purchase Details
Closed on
Aug 15, 1994
Sold by
Rowley Terese M
Bought by
Rowley Terese M and Rowley Trust
Create a Home Valuation Report for This Property
The Home Valuation Report is an in-depth analysis detailing your home's value as well as a comparison with similar homes in the area
Home Values in the Area
Average Home Value in this Area
Purchase History
| Date | Buyer | Sale Price | Title Company |
|---|---|---|---|
| Farfaras Aristidis | -- | Citywide Title Corporation | |
| Declaration Farfaras Eugenia J | -- | -- | |
| Farfaras Jennifer E | $119,000 | -- | |
| Wojcik Helen | $107,000 | -- | |
| Rowley Terese M | -- | -- |
Source: Public Records
Mortgage History
| Date | Status | Borrower | Loan Amount |
|---|---|---|---|
| Previous Owner | Farfaras Jennifer E | $95,000 |
Source: Public Records
Tax History Compared to Growth
Tax History
| Year | Tax Paid | Tax Assessment Tax Assessment Total Assessment is a certain percentage of the fair market value that is determined by local assessors to be the total taxable value of land and additions on the property. | Land | Improvement |
|---|---|---|---|---|
| 2024 | $2,889 | $17,354 | $2,710 | $14,644 |
| 2023 | $2,794 | $17,000 | $2,168 | $14,832 |
| 2022 | $2,794 | $17,000 | $2,168 | $14,832 |
| 2021 | $2,750 | $16,999 | $2,167 | $14,832 |
| 2020 | $2,314 | $13,483 | $1,354 | $12,129 |
| 2019 | $2,319 | $14,966 | $1,354 | $13,612 |
| 2018 | $2,279 | $14,966 | $1,354 | $13,612 |
| 2017 | $1,807 | $11,766 | $1,192 | $10,574 |
| 2016 | $1,857 | $11,766 | $1,192 | $10,574 |
| 2015 | $1,676 | $11,766 | $1,192 | $10,574 |
| 2014 | $2,331 | $15,123 | $1,138 | $13,985 |
| 2013 | $2,274 | $15,123 | $1,138 | $13,985 |
Source: Public Records
Map
Nearby Homes
- 5133 N Austin Ave
- 5919 W Foster Ave
- 4886 N Austin Ave
- 5133 N Marmora Ave
- 5044 N Merrimac Ave
- 5148 N Monitor Ave Unit 301
- 5254 N Mason Ave
- 5311 N Mcvicker Ave
- 5000 N Mobile Ave
- 6140 W Gunnison St Unit 3
- 5915 W Gunnison St Unit 2F
- 6228 W Lawrence Ave
- 5921 W Lawrence Ave
- 6046 W Giddings St
- 5334 N Melvina Ave
- 5705 W Higgins Ave
- 5641 W Carmen Ave
- 6316 W Lawrence Ave
- 6137 W Giddings St
- 5677 W Higgins Ave
- 5026 N Austin Ave Unit 1C
- 5022 N Austin Ave Unit 3H
- 5022 N Austin Ave Unit 3G
- 6001 W Higgins Ave Unit 3A
- 6001 W Higgins Ave Unit 1J
- 5030 N Austin Ave Unit 1A
- 5030 N Austin Ave Unit 2B
- 5026 N Austin Ave Unit 2C
- 5030 N Austin Ave Unit 2A
- 5022 N Austin Ave Unit 2G
- 5022 N Austin Ave Unit 1G
- 5026 N Austin Ave Unit 2D
- 5030 N Austin Ave Unit 1B
- 5022 N Austin Ave Unit 1H
- 5026 N Austin Ave Unit 3D
- 5026 N Austin Ave Unit 3C
- 5030 N Austin Ave Unit 3B
- 5030 N Austin Ave Unit 1B
- 5020 N Austin Ave Unit 3J
- 5020 N Austin Ave Unit 2I