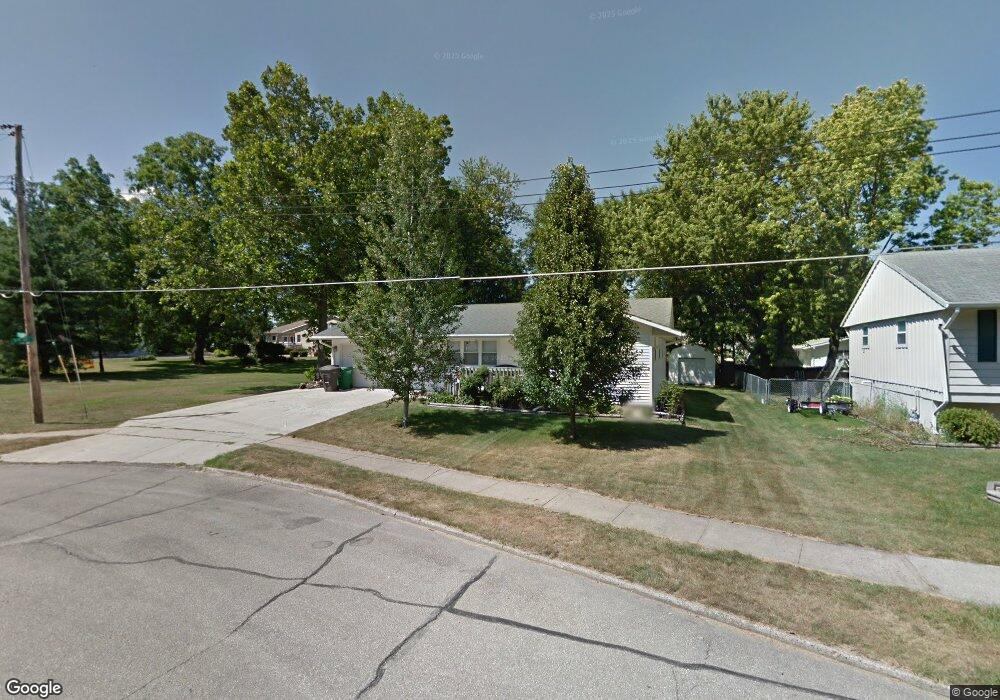
503 5th St SE Altoona, IA 50009
Estimated Value: $242,000 - $248,597
3
Beds
1
Bath
1,215
Sq Ft
$201/Sq Ft
Est. Value
About This Home
This home is located at 503 5th St SE, Altoona, IA 50009 and is currently estimated at $243,899, approximately $200 per square foot. 503 5th St SE is a home located in Polk County with nearby schools including Centennial Elementary School, Southeast Polk Spring Creek- 6th Grade, and Southeast Polk Junior High School.
Ownership History
Date
Name
Owned For
Owner Type
Purchase Details
Closed on
Mar 27, 1998
Sold by
Kepley Ruth M
Bought by
Barbaresso Anthony P and Barbaresso Jane A
Current Estimated Value
Home Financials for this Owner
Home Financials are based on the most recent Mortgage that was taken out on this home.
Original Mortgage
$68,800
Outstanding Balance
$13,117
Interest Rate
7.15%
Estimated Equity
$230,782
Create a Home Valuation Report for This Property
The Home Valuation Report is an in-depth analysis detailing your home's value as well as a comparison with similar homes in the area
Home Values in the Area
Average Home Value in this Area
Purchase History
| Date | Buyer | Sale Price | Title Company |
|---|---|---|---|
| Barbaresso Anthony P | $85,500 | -- |
Source: Public Records
Mortgage History
| Date | Status | Borrower | Loan Amount |
|---|---|---|---|
| Open | Barbaresso Anthony P | $68,800 |
Source: Public Records
Tax History Compared to Growth
Tax History
| Year | Tax Paid | Tax Assessment Tax Assessment Total Assessment is a certain percentage of the fair market value that is determined by local assessors to be the total taxable value of land and additions on the property. | Land | Improvement |
|---|---|---|---|---|
| 2024 | $3,760 | $235,700 | $40,600 | $195,100 |
| 2023 | $3,766 | $235,700 | $40,600 | $195,100 |
| 2022 | $3,716 | $193,400 | $34,400 | $159,000 |
| 2021 | $3,514 | $193,400 | $34,400 | $159,000 |
| 2020 | $3,454 | $174,600 | $31,000 | $143,600 |
| 2019 | $3,150 | $174,600 | $31,000 | $143,600 |
| 2018 | $3,152 | $157,000 | $27,200 | $129,800 |
| 2017 | $3,238 | $157,000 | $27,200 | $129,800 |
| 2016 | $3,226 | $146,600 | $25,100 | $121,500 |
| 2015 | $3,226 | $146,600 | $25,100 | $121,500 |
| 2014 | $3,222 | $145,200 | $23,900 | $121,300 |
Source: Public Records
Map
Nearby Homes
- 505 5th St SE
- 400 4th St SE
- 301 5th Street Place SE
- 136 8th NE
- 128 8th NE
- 120 8th NE
- 605 1st Ave S
- 603 1st Ave S
- 101 8th Ave SE
- 109 8th NE
- 109 8th Ave SE
- 136 8th Ave SE
- 128 8th Ave SE
- 120 8th Ave SE
- Lincoln Plan at Edgewood Trail
- Fairfield Plan at Edgewood Trail
- Madison Plan at Edgewood Trail
- Holland Plan at Edgewood Trail
- Reagan Plan at Edgewood Trail
- Neuville Plan at Edgewood Trail