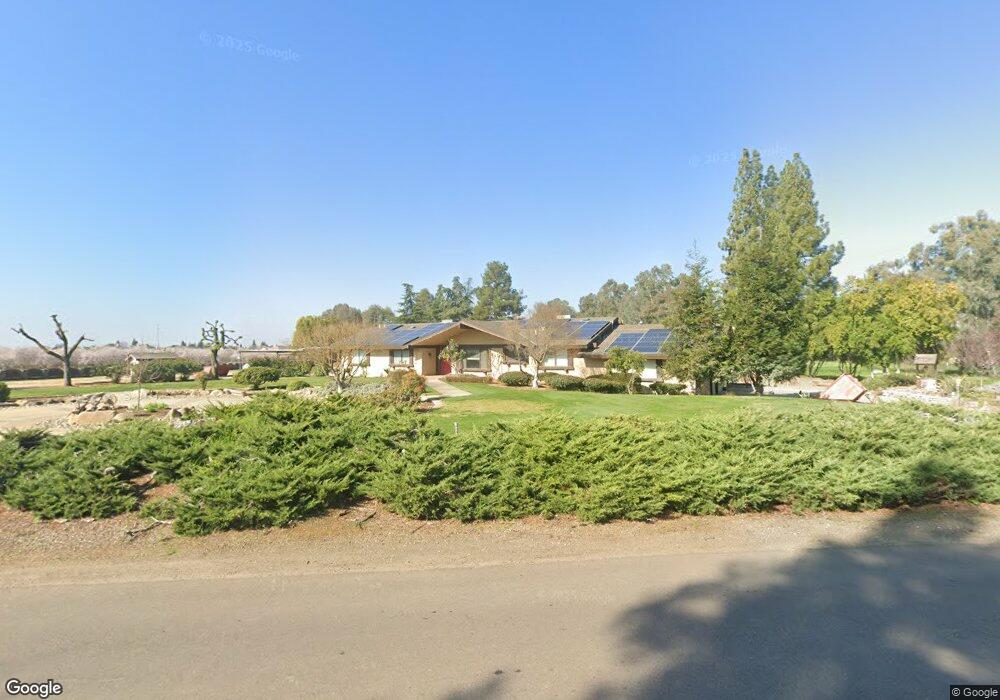
5035 N Indianola Ave Clovis, CA 93619
Estimated Value: $773,427 - $924,000
3
Beds
3
Baths
2,595
Sq Ft
$324/Sq Ft
Est. Value
About This Home
This home is located at 5035 N Indianola Ave, Clovis, CA 93619 and is currently estimated at $840,809, approximately $324 per square foot. 5035 N Indianola Ave is a home located in Fresno County with nearby schools including Cedarwood Elementary School, Clark Intermediate School, and Clovis High School.
Ownership History
Date
Name
Owned For
Owner Type
Purchase Details
Closed on
Jun 11, 2019
Sold by
Hazelton Rodney S and Hazelton Kathleen
Bought by
Hazelton Rodney S and Hazelton Kathleen H
Current Estimated Value
Create a Home Valuation Report for This Property
The Home Valuation Report is an in-depth analysis detailing your home's value as well as a comparison with similar homes in the area
Purchase History
| Date | Buyer | Sale Price | Title Company |
|---|---|---|---|
| Hazelton Rodney S | -- | None Available |
Source: Public Records
Tax History
| Year | Tax Paid | Tax Assessment Tax Assessment Total Assessment is a certain percentage of the fair market value that is determined by local assessors to be the total taxable value of land and additions on the property. | Land | Improvement |
|---|---|---|---|---|
| 2025 | $4,025 | $348,492 | $39,928 | $308,564 |
| 2023 | $3,869 | $334,962 | $38,379 | $296,583 |
| 2022 | $3,816 | $328,395 | $37,627 | $290,768 |
| 2021 | $3,707 | $321,957 | $36,890 | $285,067 |
| 2020 | $3,692 | $318,656 | $36,512 | $282,144 |
| 2019 | $3,619 | $312,409 | $35,797 | $276,612 |
| 2018 | $3,538 | $306,285 | $35,096 | $271,189 |
| 2017 | $3,476 | $300,280 | $34,408 | $265,872 |
| 2016 | $3,356 | $294,393 | $33,734 | $260,659 |
| 2015 | $3,304 | $289,972 | $33,228 | $256,744 |
| 2014 | $3,241 | $284,293 | $32,578 | $251,715 |
Source: Public Records
Map
Nearby Homes
- 11078 Sawtooth Peak Way
- 4674 N Arrow Ridge Way
- 4769 N Emerald Peak Dr
- 4626 N Arrow Ridge Way
- 10952 E Promontory Way
- 10588 E Fieldstone Ave
- 10595 E San Felipe Ave
- 4199 N Quail Crossing
- 6090 Amber Ave
- 4133 N Morro Bay
- 12000 E Shaw Ave
- 4588 N Mccall Ave
- 5276 Poinsetta Ave
- 6345 N Bethel Ave
- 12804 E Alamos Ave
- 3520 N Bethel Ave
- 3215 Lourdes Ave
- 11236 E Herndon Ave
- 12740 E Robinson Ave
- 4373 Rialto Ave
- 5087 N Indianola Ave
- 5034 N Indianola Ave
- 5088 N Indianola Ave
- 5149 N Indianola Ave
- 5150 N Indianola Ave
- 5211 N Indianola Ave
- 0 E Shaw Ave
- 5212 N Indianola Ave
- 5036 Amber Ave
- 5152 Amber Ave
- 5090 Amber Ave
- 5214 Amber Ave
- 5273 N Indianola Ave
- 5037 Amber Ave
- 5037 Amber Ave
- 11094 E Greenbury Way
- 5151 Amber Ave
- 5089 Amber Ave
- 11087 E Greenbury Way
- 11082 E Greenbury Way