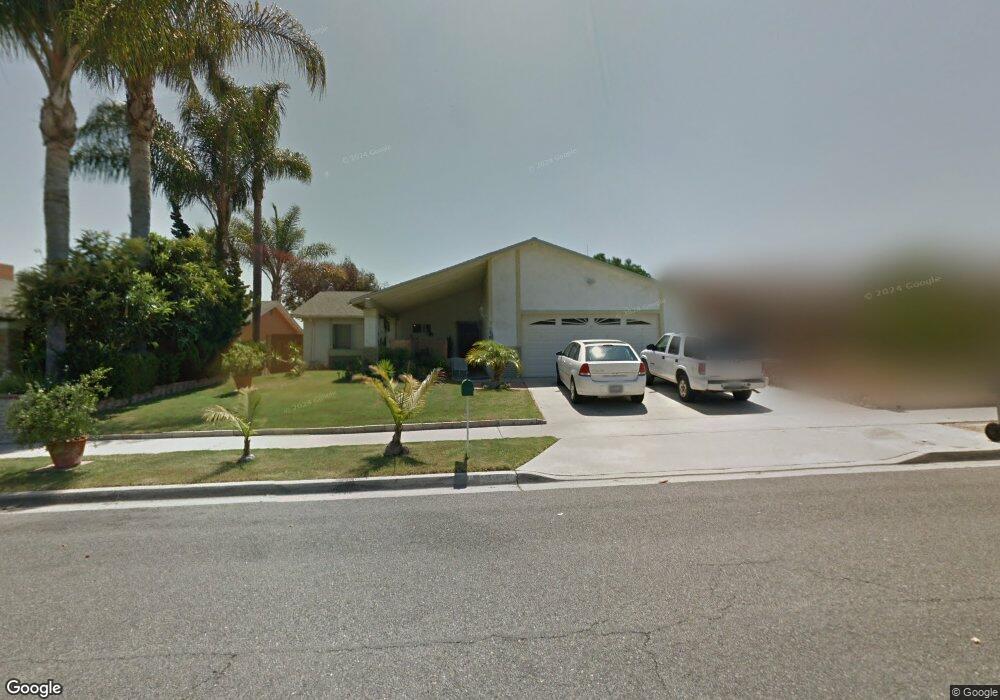
5046 Tyler St Oceanside, CA 92057
Guajome NeighborhoodEstimated Value: $752,000 - $821,000
3
Beds
2
Baths
1,372
Sq Ft
$567/Sq Ft
Est. Value
About This Home
This home is located at 5046 Tyler St, Oceanside, CA 92057 and is currently estimated at $778,000, approximately $567 per square foot. 5046 Tyler St is a home located in San Diego County with nearby schools including Del Rio Elementary School, Cesar Chavez Middle School, and El Camino High School.
Ownership History
Date
Name
Owned For
Owner Type
Purchase Details
Closed on
Aug 31, 1993
Sold by
Meredith Jesse L
Bought by
Lingo Edwin J and Lingo Teresa
Current Estimated Value
Home Financials for this Owner
Home Financials are based on the most recent Mortgage that was taken out on this home.
Original Mortgage
$129,540
Interest Rate
6.94%
Mortgage Type
VA
Purchase Details
Closed on
Jul 11, 1983
Create a Home Valuation Report for This Property
The Home Valuation Report is an in-depth analysis detailing your home's value as well as a comparison with similar homes in the area
Home Values in the Area
Average Home Value in this Area
Purchase History
| Date | Buyer | Sale Price | Title Company |
|---|---|---|---|
| Lingo Edwin J | $127,000 | First American Title Co | |
| -- | $95,000 | -- |
Source: Public Records
Mortgage History
| Date | Status | Borrower | Loan Amount |
|---|---|---|---|
| Closed | Lingo Edwin J | $129,540 |
Source: Public Records
Tax History
| Year | Tax Paid | Tax Assessment Tax Assessment Total Assessment is a certain percentage of the fair market value that is determined by local assessors to be the total taxable value of land and additions on the property. | Land | Improvement |
|---|---|---|---|---|
| 2025 | $2,339 | $215,823 | $84,585 | $131,238 |
| 2024 | $2,339 | $211,592 | $82,927 | $128,665 |
| 2023 | $2,265 | $207,444 | $81,301 | $126,143 |
| 2022 | $2,229 | $203,377 | $79,707 | $123,670 |
| 2021 | $2,237 | $199,391 | $78,145 | $121,246 |
| 2020 | $2,168 | $197,347 | $77,344 | $120,003 |
| 2019 | $2,104 | $193,478 | $75,828 | $117,650 |
| 2018 | $2,080 | $189,686 | $74,342 | $115,344 |
| 2017 | $71 | $185,968 | $72,885 | $113,083 |
| 2016 | $1,973 | $182,322 | $71,456 | $110,866 |
| 2015 | $1,915 | $179,584 | $70,383 | $109,201 |
| 2014 | $1,841 | $176,067 | $69,005 | $107,062 |
Source: Public Records
Map
Nearby Homes
- 4877 Merida Way
- 4885 Merida Way
- 5108 Andrew Jackson St
- 185 Harrison St
- 154 Harrison St
- 5462 Mae Way
- 5462 Giovanni Way
- 104 Mellano Way
- 119 Takamasa Way
- 150 N River Cir Unit 105
- 110 Takamasa Way
- 131 Mellano Way
- 130 Mellano Way
- 5033 Los Morros Way Unit 55
- 111 Metz Way
- 107 Metz Way
- 5516 Giovanni Way
- 114 Metz Way
- 5063 Waterview Way
- 5065 Waterview Way
Your Personal Tour Guide
Ask me questions while you tour the home.