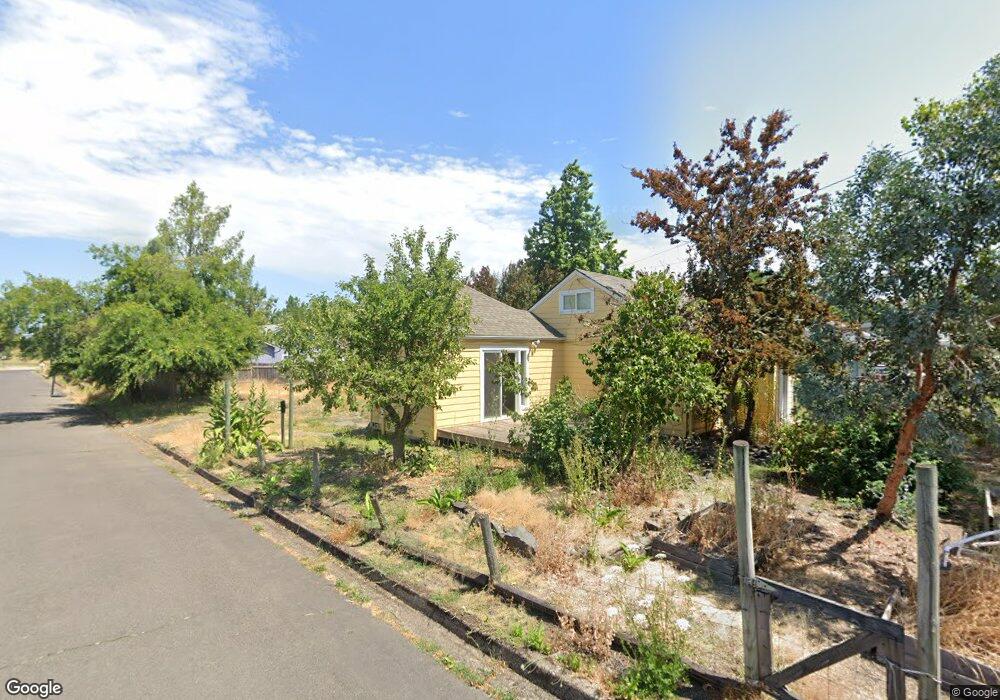
505 E 31st Ave Eugene, OR 97405
Southeast Eugene NeighborhoodEstimated Value: $422,000 - $472,000
3
Beds
2
Baths
1,174
Sq Ft
$382/Sq Ft
Est. Value
About This Home
This home is located at 505 E 31st Ave, Eugene, OR 97405 and is currently estimated at $448,820, approximately $382 per square foot. 505 E 31st Ave is a home located in Lane County with nearby schools including Adams Elementary School, Spencer Butte Middle School, and South Eugene High School.
Ownership History
Date
Name
Owned For
Owner Type
Purchase Details
Closed on
Jan 16, 2025
Sold by
Rental 2006 Llc
Bought by
Allison David Wayne and Hall Leslie Duke
Current Estimated Value
Home Financials for this Owner
Home Financials are based on the most recent Mortgage that was taken out on this home.
Original Mortgage
$340,000
Outstanding Balance
$337,475
Interest Rate
6.69%
Mortgage Type
Construction
Estimated Equity
$111,345
Purchase Details
Closed on
Jan 23, 2015
Sold by
Allison David W and Hall Leslie D
Bought by
Rental 2006 Llc
Purchase Details
Closed on
Dec 27, 2006
Sold by
Johnson Julie Jo
Bought by
Allison David W and Hall Leslie D
Home Financials for this Owner
Home Financials are based on the most recent Mortgage that was taken out on this home.
Original Mortgage
$188,000
Interest Rate
6.22%
Mortgage Type
Purchase Money Mortgage
Create a Home Valuation Report for This Property
The Home Valuation Report is an in-depth analysis detailing your home's value as well as a comparison with similar homes in the area
Home Values in the Area
Average Home Value in this Area
Purchase History
| Date | Buyer | Sale Price | Title Company |
|---|---|---|---|
| Allison David Wayne | -- | Fidelity National Title | |
| Allison David Wayne | -- | Fidelity National Title | |
| Rental 2006 Llc | -- | None Available | |
| Allison David W | $235,000 | Fidelity National Title Insu |
Source: Public Records
Mortgage History
| Date | Status | Borrower | Loan Amount |
|---|---|---|---|
| Open | Allison David Wayne | $340,000 | |
| Closed | Allison David Wayne | $340,000 | |
| Previous Owner | Allison David W | $188,000 |
Source: Public Records
Tax History
| Year | Tax Paid | Tax Assessment Tax Assessment Total Assessment is a certain percentage of the fair market value that is determined by local assessors to be the total taxable value of land and additions on the property. | Land | Improvement |
|---|---|---|---|---|
| 2025 | $3,301 | $169,420 | -- | -- |
| 2024 | $3,260 | $164,486 | -- | -- |
| 2023 | $3,260 | $159,696 | -- | -- |
| 2022 | $3,054 | $155,045 | $0 | $0 |
| 2021 | $2,868 | $150,530 | $0 | $0 |
| 2020 | $2,879 | $146,146 | $0 | $0 |
| 2019 | $2,780 | $141,890 | $0 | $0 |
| 2018 | $2,617 | $133,746 | $0 | $0 |
| 2017 | $2,500 | $133,746 | $0 | $0 |
| 2016 | $2,438 | $129,850 | $0 | $0 |
| 2015 | $2,368 | $126,068 | $0 | $0 |
| 2014 | $2,320 | $122,396 | $0 | $0 |
Source: Public Records
Map
Nearby Homes
- 3023 Hummingbird Ln
- 3031 Hummingbird Ln
- 310 1/2 E 31st Ave Unit 1
- 790 E 32nd Ave
- 2815 Hilyard St
- 555 Stafford Ct
- 585 E 36th Ave
- 2683 Alder St
- 2965 Olive St
- 2571 Alder St
- 3392 Onyx Place
- 84 W 27th Ave
- 75 W 35th Place
- 3605 Emerald St
- 275 E 39th Ave
- 1180 E 37th Ave
- 0 E 39th Ave
- 434 E 39th Ave
- 2630 Onyx St
- 940 E 23rd Ave
- 515 E 31st Ave
- 3065 Ferry St
- 3080 Ferry St
- 485 E 31st Ave
- 535 E 31st Ave
- 3035 Ferry St
- 455 E 31st Ave
- 510 E 31st Ave
- 3060 Ferry St
- 541 E 31st Ave
- 492 E 31st Ave
- 3040 Ferry St
- 520 E 31st Ave
- 520 E 31st Ave Unit Parc2
- 490 E 31st Ave
- 435 E 31st Ave
- 3025 Ferry St
- 3018 Hummingbird Ln
- 530 E 31st Ave
- 460 E 31st Ave
Your Personal Tour Guide
Ask me questions while you tour the home.