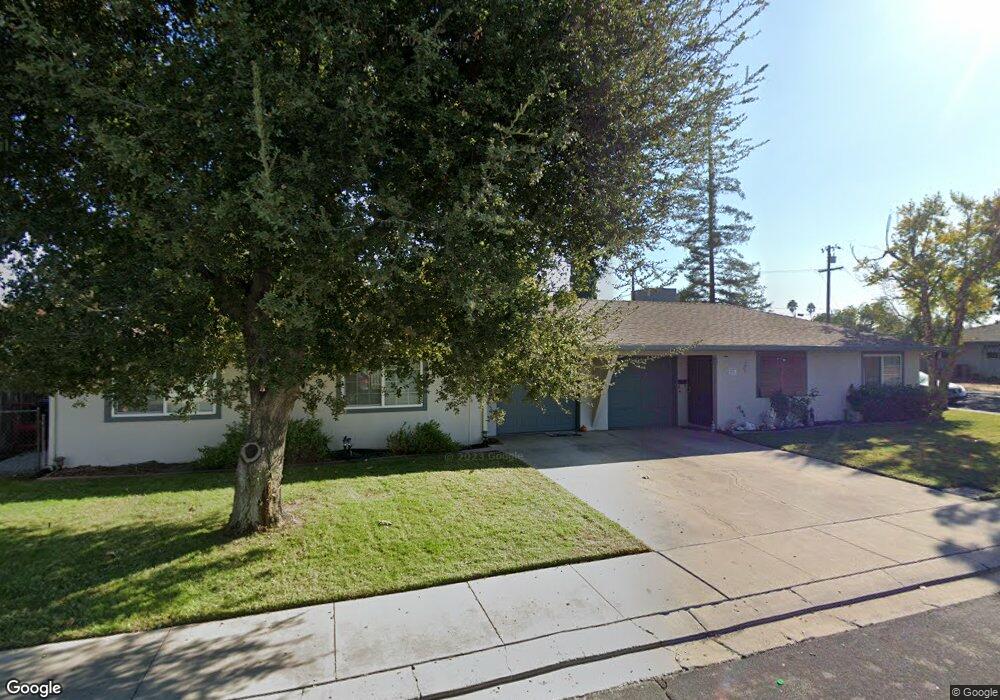
506 Mulberry Cir Manteca, CA 95337
Downtown Manteca NeighborhoodEstimated Value: $444,000 - $655,000
--
Bed
--
Bath
--
Sq Ft
9,714
Sq Ft Lot
About This Home
This home is located at 506 Mulberry Cir, Manteca, CA 95337 and is currently estimated at $523,000. 506 Mulberry Cir is a home located in San Joaquin County with nearby schools including Sequoia Elementary School, Manteca High School, and St. Anthony's Catholic School.
Ownership History
Date
Name
Owned For
Owner Type
Purchase Details
Closed on
Aug 28, 2017
Sold by
Dale Ronald L and Ronald L Dale Sr Trust
Bought by
Dale Ronald L and Dale Georgia H
Current Estimated Value
Purchase Details
Closed on
Aug 9, 2006
Sold by
Dale Ronald
Bought by
Dale Ronald L and Ronald L Dale Sr Trust
Purchase Details
Closed on
Apr 8, 2002
Sold by
Dale Ronald L
Bought by
Dale Ronald L and Dale Georgia H
Purchase Details
Closed on
Feb 5, 2001
Sold by
Dale Georgia H
Bought by
Dale Ronald L
Home Financials for this Owner
Home Financials are based on the most recent Mortgage that was taken out on this home.
Original Mortgage
$168,750
Interest Rate
7.13%
Mortgage Type
Stand Alone First
Purchase Details
Closed on
Jan 30, 2001
Sold by
Dale Georgia H
Bought by
Dale Ronald L
Home Financials for this Owner
Home Financials are based on the most recent Mortgage that was taken out on this home.
Original Mortgage
$168,750
Interest Rate
7.13%
Mortgage Type
Stand Alone First
Create a Home Valuation Report for This Property
The Home Valuation Report is an in-depth analysis detailing your home's value as well as a comparison with similar homes in the area
Home Values in the Area
Average Home Value in this Area
Purchase History
| Date | Buyer | Sale Price | Title Company |
|---|---|---|---|
| Dale Ronald L | -- | None Available | |
| Dale Ronald L | -- | None Available | |
| Dale Ronald L | -- | None Available | |
| Dale Ronald L | -- | -- | |
| Dale Ronald L | -- | Alliance Title Company | |
| Dale Ronald L | -- | Alliance Title Company |
Source: Public Records
Mortgage History
| Date | Status | Borrower | Loan Amount |
|---|---|---|---|
| Closed | Dale Ronald L | $168,750 |
Source: Public Records
Tax History Compared to Growth
Tax History
| Year | Tax Paid | Tax Assessment Tax Assessment Total Assessment is a certain percentage of the fair market value that is determined by local assessors to be the total taxable value of land and additions on the property. | Land | Improvement |
|---|---|---|---|---|
| 2025 | $1,092 | $94,877 | $9,271 | $85,606 |
| 2024 | $1,062 | $93,018 | $9,090 | $83,928 |
| 2023 | $1,049 | $91,195 | $8,912 | $82,283 |
| 2022 | $1,033 | $89,408 | $8,738 | $80,670 |
| 2021 | $1,023 | $87,656 | $8,567 | $79,089 |
| 2020 | $982 | $86,759 | $8,480 | $78,279 |
| 2019 | $970 | $85,059 | $8,314 | $76,745 |
| 2018 | $957 | $83,392 | $8,151 | $75,241 |
| 2017 | $944 | $81,758 | $7,992 | $73,766 |
| 2016 | $921 | $80,155 | $7,835 | $72,320 |
| 2014 | $854 | $77,405 | $7,566 | $69,839 |
Source: Public Records
Map
Nearby Homes
- 588 Mulberry Cir
- 832 Marion St
- 883 El Dorado St
- 1015 Tenaya Ct
- 1033 Tenaya Ct
- 712 Virginia St
- 1164 Marion St
- 1176 Liggett Ct
- 119 Almond Ave
- 620 Nevada St
- 819 Wawona St
- 215 Almond Ave
- 1267 Christine Ct
- 150 N Veach Ave
- 776 Folsom Way
- 1061 Chianti Ln
- 978 Swan Dr
- 1108 Mission Ridge Dr
- 1338 Alfa Romeo Ct
- 360 Park Ave