506 Steele St High Point, NC 27262
Downtown High Point NeighborhoodEstimated Value: $111,000 - $233,000
6
Beds
4
Baths
1,499
Sq Ft
$117/Sq Ft
Est. Value
About This Home
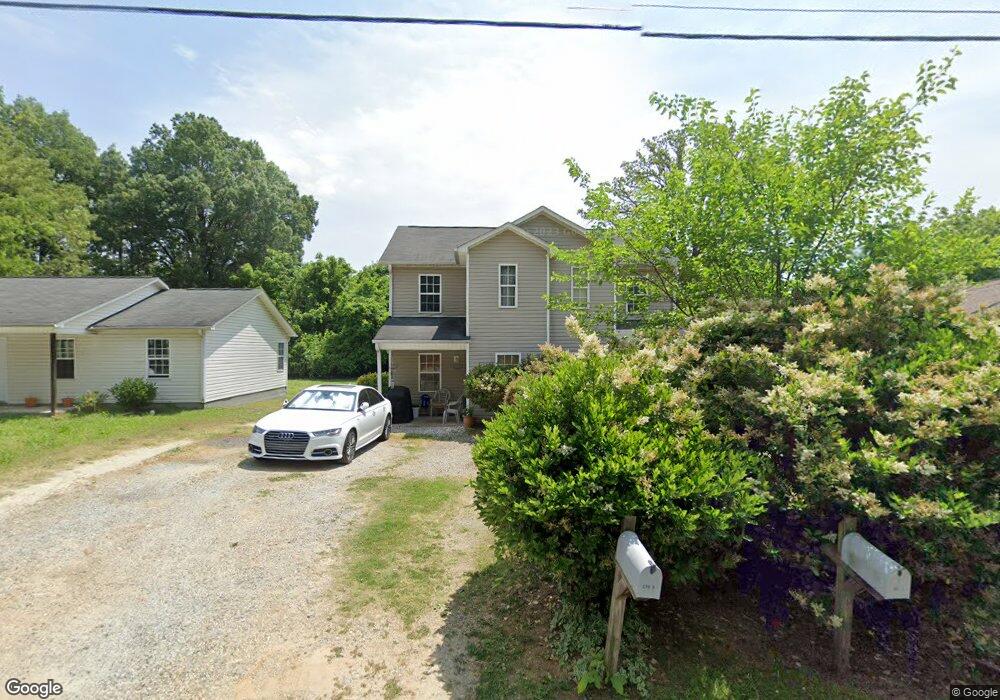
This home is located at 506 Steele St, High Point, NC 27262 and is currently estimated at $176,000, approximately $117 per square foot. 506 Steele St is a home located in Guilford County with nearby schools including Northwood Elementary School, Ferndale Middle School, and High Point Central High School.
Ownership History
Date
Name
Owned For
Owner Type
Purchase Details
Closed on
Aug 3, 2020
Sold by
Hensley Rodney D and Hensley Lavinia B
Bought by
Hensley Investment Properties Inc
Current Estimated Value
Home Financials for this Owner
Home Financials are based on the most recent Mortgage that was taken out on this home.
Original Mortgage
$1,800,000
Outstanding Balance
$952,327
Interest Rate
3%
Mortgage Type
Construction
Estimated Equity
-$776,327
Purchase Details
Closed on
Sep 18, 2006
Sold by
Hensley Investment Properties Inc
Bought by
Hensley Rodney D and Hensley Lavinia B
Purchase Details
Closed on
Apr 15, 2004
Sold by
Obrien Michael E and Obrien Paralee D
Bought by
Hensley Investment Properties Inc
Home Financials for this Owner
Home Financials are based on the most recent Mortgage that was taken out on this home.
Original Mortgage
$53,490
Interest Rate
5.38%
Mortgage Type
Construction
Create a Home Valuation Report for This Property
The Home Valuation Report is an in-depth analysis detailing your home's value as well as a comparison with similar homes in the area
Home Values in the Area
Average Home Value in this Area
Purchase History
| Date | Buyer | Sale Price | Title Company |
|---|---|---|---|
| Hensley Investment Properties Inc | -- | None Available | |
| Hensley Rodney D | -- | None Available | |
| Hensley Investment Properties Inc | $52,000 | -- |
Source: Public Records
Mortgage History
| Date | Status | Borrower | Loan Amount |
|---|---|---|---|
| Open | Hensley Investment Properties Inc | $1,800,000 | |
| Previous Owner | Hensley Investment Properties Inc | $53,490 |
Source: Public Records
Tax History
| Year | Tax Paid | Tax Assessment Tax Assessment Total Assessment is a certain percentage of the fair market value that is determined by local assessors to be the total taxable value of land and additions on the property. | Land | Improvement |
|---|---|---|---|---|
| 2025 | $1,532 | $111,200 | $10,000 | $101,200 |
| 2024 | $1,532 | $111,200 | $10,000 | $101,200 |
| 2023 | $1,532 | $111,200 | $10,000 | $101,200 |
| 2022 | $1,499 | $111,200 | $10,000 | $101,200 |
| 2021 | $1,458 | $105,800 | $10,000 | $95,800 |
| 2020 | $1,458 | $105,800 | $10,000 | $95,800 |
| 2019 | $1,458 | $105,800 | $0 | $0 |
| 2018 | $1,451 | $105,800 | $0 | $0 |
| 2017 | $1,458 | $105,800 | $0 | $0 |
| 2016 | $1,645 | $117,300 | $0 | $0 |
| 2015 | $1,654 | $117,300 | $0 | $0 |
| 2014 | $1,682 | $117,300 | $0 | $0 |
Source: Public Records
Map
Nearby Homes
- 905 Mint Ave
- 719 Forrest St
- 721 Forrest St
- 304 Louise Ave
- 837 Willow Place
- 844 Willow Place
- 511 E Farriss Ave
- 702 E Farriss Ave
- 114 Eccles Place
- 705 Delmont St
- 916 Forrest St
- 513 Saunders Place Unit A & B
- 511 Saunders Place Unit A & B
- 949 Council St
- 1506 East Ave
- 610 Colonial Dr
- 1504 East Ave
- 402 Walnut St
- 1310 Madison St
- 1113 Clyde Place
Your Personal Tour Guide
Ask me questions while you tour the home.