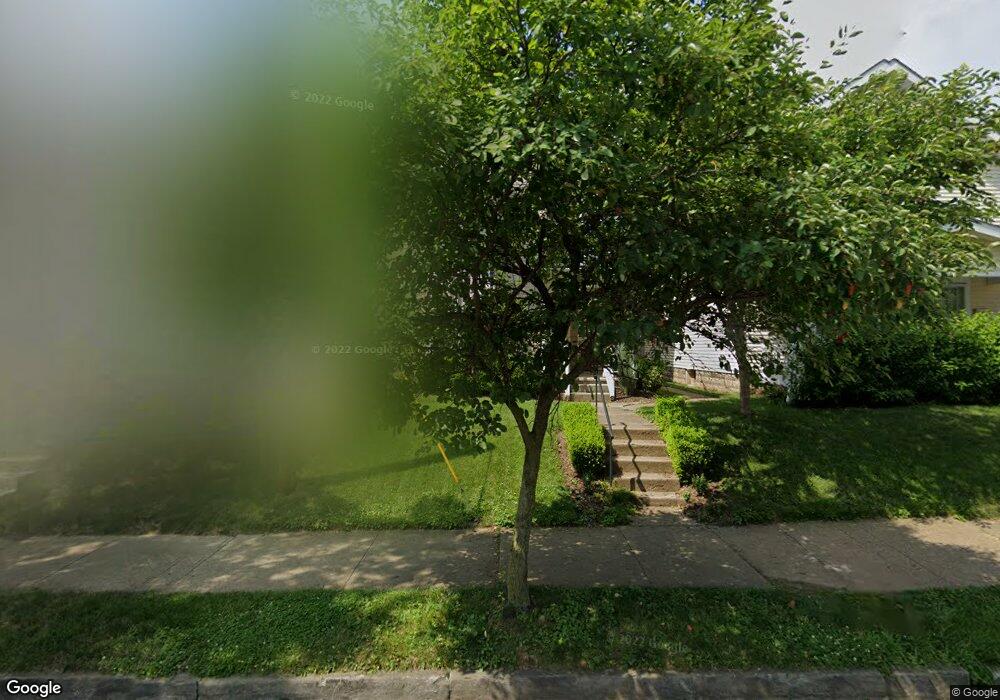
506 W 2nd Ave Unit 506 Columbus, OH 43201
Harrison West NeighborhoodEstimated Value: $489,077 - $532,000
3
Beds
2
Baths
1,560
Sq Ft
$330/Sq Ft
Est. Value
About This Home
This home is located at 506 W 2nd Ave Unit 506, Columbus, OH 43201 and is currently estimated at $514,269, approximately $329 per square foot. 506 W 2nd Ave Unit 506 is a home located in Franklin County with nearby schools including Hubbard Elementary School, Dominion Middle School, and Whetstone High School.
Ownership History
Date
Name
Owned For
Owner Type
Purchase Details
Closed on
Mar 5, 2008
Sold by
Foster Kristopher S and Foster Amelia M
Bought by
Bergandine Jeffrey M
Current Estimated Value
Home Financials for this Owner
Home Financials are based on the most recent Mortgage that was taken out on this home.
Original Mortgage
$228,907
Interest Rate
5.74%
Mortgage Type
FHA
Purchase Details
Closed on
Dec 8, 2006
Sold by
Seagle Gary T
Bought by
Foster Kristopher S and Foster Amelia M
Home Financials for this Owner
Home Financials are based on the most recent Mortgage that was taken out on this home.
Original Mortgage
$122,550
Interest Rate
7.55%
Mortgage Type
Purchase Money Mortgage
Purchase Details
Closed on
Apr 2, 2002
Sold by
Seagle Helen L
Bought by
Seagle Gary T
Purchase Details
Closed on
May 24, 1971
Bought by
Seagle Helen L
Create a Home Valuation Report for This Property
The Home Valuation Report is an in-depth analysis detailing your home's value as well as a comparison with similar homes in the area
Home Values in the Area
Average Home Value in this Area
Purchase History
| Date | Buyer | Sale Price | Title Company |
|---|---|---|---|
| Bergandine Jeffrey M | $232,500 | Cornerstone Title Agency Llc | |
| Foster Kristopher S | $129,000 | Stewart Tit | |
| Seagle Gary T | -- | -- | |
| Seagle Helen L | -- | -- |
Source: Public Records
Mortgage History
| Date | Status | Borrower | Loan Amount |
|---|---|---|---|
| Previous Owner | Bergandine Jeffrey M | $228,907 | |
| Previous Owner | Foster Kristopher S | $122,550 |
Source: Public Records
Tax History Compared to Growth
Tax History
| Year | Tax Paid | Tax Assessment Tax Assessment Total Assessment is a certain percentage of the fair market value that is determined by local assessors to be the total taxable value of land and additions on the property. | Land | Improvement |
|---|---|---|---|---|
| 2024 | $6,318 | $140,780 | $64,400 | $76,380 |
| 2023 | $6,237 | $140,780 | $64,400 | $76,380 |
| 2022 | $7,708 | $148,620 | $44,910 | $103,710 |
| 2021 | $7,722 | $148,620 | $44,910 | $103,710 |
| 2020 | $7,732 | $148,620 | $44,910 | $103,710 |
| 2019 | $6,678 | $110,080 | $33,250 | $76,830 |
| 2018 | $5,793 | $110,080 | $33,250 | $76,830 |
| 2017 | $6,674 | $110,080 | $33,250 | $76,830 |
| 2016 | $5,421 | $81,840 | $17,050 | $64,790 |
| 2015 | $4,921 | $81,840 | $17,050 | $64,790 |
| 2014 | $4,933 | $81,840 | $17,050 | $64,790 |
| 2013 | $1,042 | $35,035 | $6,790 | $28,245 |
Source: Public Records
Map
Nearby Homes
- 475 W 2nd Ave
- 537 W 3rd Ave Unit 537
- 1025 Oregon Ave
- 0 Bradley St
- 1003 Pennsylvania Ave Unit 5
- 496 W 1st Ave
- 477 W 4th Ave
- 1173 Perry St Unit 20P
- 539 W 1st Ave Unit 310
- 506 Riverfront Ln
- 337 Tappan St
- 502 Riverfront Ln
- 512 Riverfront Ln
- 994 Harrison Ave
- 516 Riverfront Ln
- 953 Ingleside Ave Unit 314
- 319 W 2nd Ave Unit 319
- 925 Ingleside Ave Unit 111
- 925 Ingleside Ave Unit 213
- 925 Ingleside Ave Unit 303
- 510 W 2nd Ave
- 502 W 2nd Ave
- 502 W 2nd Ave
- 498 W 2nd Ave Unit 500
- 516 W 2nd Ave Unit 518
- 1081 Oregon Ave
- 520 W 2nd Ave
- 503 W 2nd Ave
- 1085 Oregon Ave
- 526 W 2nd Ave
- 526 W 2nd Ave
- 488 W 2nd Ave
- 1089 Oregon Ave
- 505 W 2nd Ave
- 499 W 2nd Ave
- 1082 Perry St
- 511 W 2nd Ave
- 509 W 2nd Ave
- 530 W 2nd Ave
- 1078 Perry St