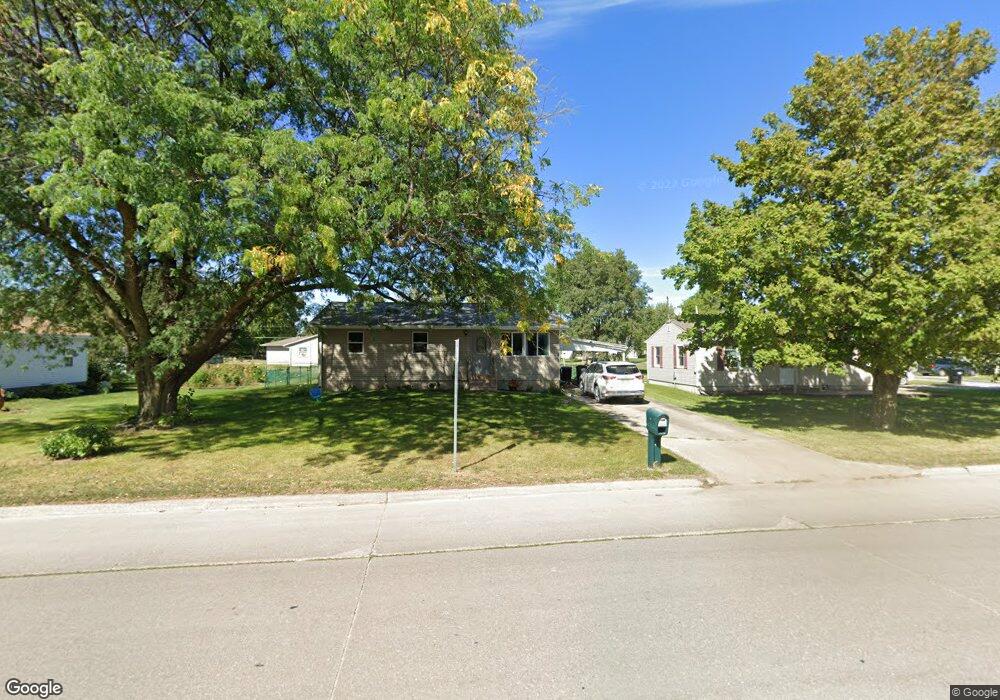
507 E 13th St Vinton, IA 52349
Estimated Value: $106,000 - $173,000
3
Beds
1
Bath
1,824
Sq Ft
$78/Sq Ft
Est. Value
About This Home
This home is located at 507 E 13th St, Vinton, IA 52349 and is currently estimated at $141,671, approximately $77 per square foot. 507 E 13th St is a home located in Benton County with nearby schools including Tilford Elementary School, Shellsburg Elementary School, and Vinton-Shellsburg Middle School.
Ownership History
Date
Name
Owned For
Owner Type
Purchase Details
Closed on
Jun 14, 2019
Sold by
Follman Denise A and Joyal Joseph A
Bought by
Johnson Nicholas D and Johnson Amy R
Current Estimated Value
Purchase Details
Closed on
May 27, 2005
Sold by
Goodall Malinda A and Eastwood James L
Bought by
Follmann Gary G and Follmann Denise A
Home Financials for this Owner
Home Financials are based on the most recent Mortgage that was taken out on this home.
Original Mortgage
$79,800
Interest Rate
5.91%
Mortgage Type
New Conventional
Create a Home Valuation Report for This Property
The Home Valuation Report is an in-depth analysis detailing your home's value as well as a comparison with similar homes in the area
Home Values in the Area
Average Home Value in this Area
Purchase History
| Date | Buyer | Sale Price | Title Company |
|---|---|---|---|
| Johnson Nicholas D | $65,000 | -- | |
| Follmann Gary G | $84,000 | None Available |
Source: Public Records
Mortgage History
| Date | Status | Borrower | Loan Amount |
|---|---|---|---|
| Previous Owner | Follmann Gary G | $79,800 |
Source: Public Records
Tax History Compared to Growth
Tax History
| Year | Tax Paid | Tax Assessment Tax Assessment Total Assessment is a certain percentage of the fair market value that is determined by local assessors to be the total taxable value of land and additions on the property. | Land | Improvement |
|---|---|---|---|---|
| 2025 | $1,958 | $117,300 | $17,900 | $99,400 |
| 2024 | $1,958 | $104,500 | $17,600 | $86,900 |
| 2023 | $1,816 | $104,500 | $17,600 | $86,900 |
| 2022 | $1,864 | $84,400 | $14,100 | $70,300 |
| 2021 | $1,864 | $84,400 | $14,100 | $70,300 |
| 2020 | $1,734 | $82,500 | $10,900 | $71,600 |
| 2019 | $1,534 | $80,100 | $10,900 | $69,200 |
| 2018 | $1,486 | $78,500 | $10,300 | $68,200 |
| 2017 | $1,420 | $78,500 | $10,300 | $68,200 |
| 2016 | $1,394 | $73,300 | $9,600 | $63,700 |
| 2015 | $1,394 | $73,300 | $9,600 | $63,700 |
| 2014 | $1,490 | $77,600 | $0 | $0 |
Source: Public Records
Map
Nearby Homes