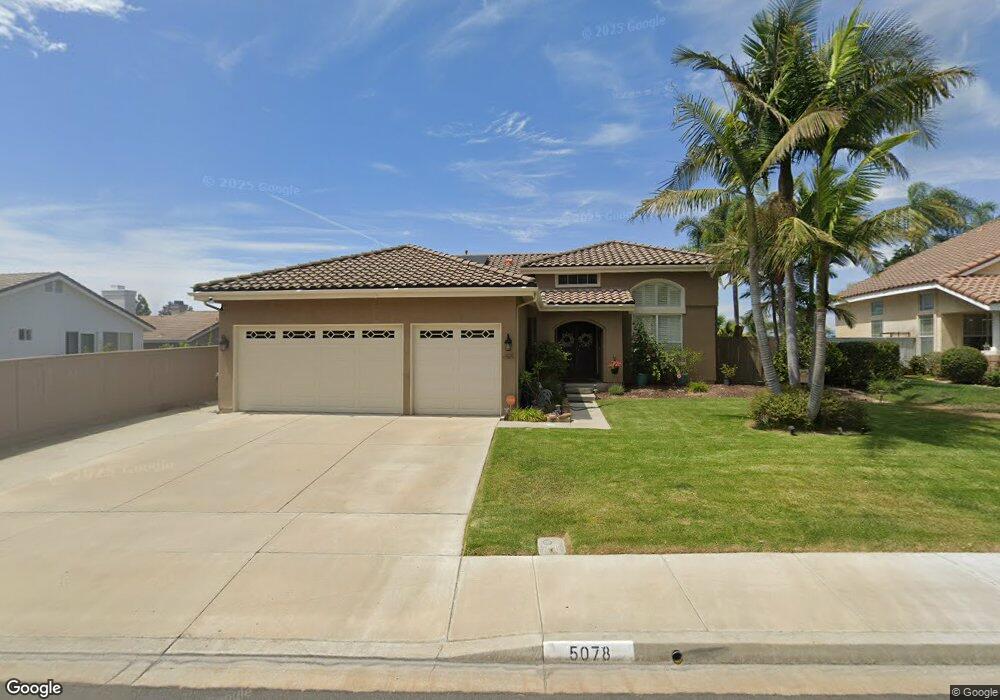
5078 Palmera Dr Oceanside, CA 92056
Guajome NeighborhoodEstimated Value: $1,009,582 - $1,167,000
4
Beds
2
Baths
2,057
Sq Ft
$542/Sq Ft
Est. Value
About This Home
This home is located at 5078 Palmera Dr, Oceanside, CA 92056 and is currently estimated at $1,115,146, approximately $542 per square foot. 5078 Palmera Dr is a home located in San Diego County with nearby schools including Alamosa Park Elementary School, Roosevelt Middle School, and Vista High School.
Ownership History
Date
Name
Owned For
Owner Type
Purchase Details
Closed on
May 18, 2012
Sold by
Miller Jay and Miller Jean M
Bought by
Miller Jay and Miller Jeannie
Current Estimated Value
Home Financials for this Owner
Home Financials are based on the most recent Mortgage that was taken out on this home.
Original Mortgage
$175,000
Outstanding Balance
$120,964
Interest Rate
3.85%
Mortgage Type
New Conventional
Estimated Equity
$994,182
Purchase Details
Closed on
Sep 21, 2007
Sold by
Miller Jay and Miller Jeannie M
Bought by
Miller Jay and Miller Jeannie
Purchase Details
Closed on
Aug 20, 1996
Sold by
Centex Real Estate Corp
Bought by
Miller Jay and Miller Jeannie M
Home Financials for this Owner
Home Financials are based on the most recent Mortgage that was taken out on this home.
Original Mortgage
$153,600
Interest Rate
7.88%
Create a Home Valuation Report for This Property
The Home Valuation Report is an in-depth analysis detailing your home's value as well as a comparison with similar homes in the area
Home Values in the Area
Average Home Value in this Area
Purchase History
| Date | Buyer | Sale Price | Title Company |
|---|---|---|---|
| Miller Jay | -- | Accommodation | |
| Miller Jay | -- | Ticor Title Company | |
| Miller Jay | -- | None Available | |
| Miller Jay | $205,000 | Continental Lawyers Title Co |
Source: Public Records
Mortgage History
| Date | Status | Borrower | Loan Amount |
|---|---|---|---|
| Open | Miller Jay | $175,000 | |
| Closed | Miller Jay | $153,600 |
Source: Public Records
Tax History Compared to Growth
Tax History
| Year | Tax Paid | Tax Assessment Tax Assessment Total Assessment is a certain percentage of the fair market value that is determined by local assessors to be the total taxable value of land and additions on the property. | Land | Improvement |
|---|---|---|---|---|
| 2025 | $4,198 | $381,240 | $73,273 | $307,967 |
| 2024 | $4,198 | $373,766 | $71,837 | $301,929 |
| 2023 | $4,100 | $366,438 | $70,429 | $296,009 |
| 2022 | $4,088 | $359,254 | $69,049 | $290,205 |
| 2021 | $3,999 | $352,211 | $67,696 | $284,515 |
| 2020 | $3,985 | $348,600 | $67,002 | $281,598 |
| 2019 | $3,928 | $341,766 | $65,689 | $276,077 |
| 2018 | $3,741 | $335,065 | $64,401 | $270,664 |
| 2017 | $70 | $328,496 | $63,139 | $265,357 |
| 2016 | $3,589 | $322,055 | $61,901 | $260,154 |
| 2015 | $3,574 | $317,219 | $60,972 | $256,247 |
| 2014 | $3,489 | $311,006 | $59,778 | $251,228 |
Source: Public Records
Map
Nearby Homes
- 5014 Palmera Dr
- 1359 Cottonwood Dr
- 1314 Woodview Dr
- 5141 Palmera Dr
- 1328 Woodhaven Dr
- 1366 Panorama Ridge Rd
- 5236 Palmera Dr
- 1385 Temple Heights Dr
- 1216 Woodview Dr
- 5126 Maplewood Cir
- 1426 Westwood Place
- 1441 Peacock Blvd
- 1208 Darwin Dr
- 5237 Rosewood Dr
- 1463 Westmore Place
- 1460 Highridge Dr
- 1545 Marjorie St
- 4867 Meadowbrook Dr
- 904 Robinwood Dr
- 1523 Temple Heights Dr
- 5082 Palmera Dr
- 5056 Palmera Dr
- 5052 Palmera Dr
- 5048 Palmera Dr
- 1431 Woodhaven Dr
- 1423 Woodhaven Dr
- 1427 Woodhaven Dr
- 5044 Palmera Dr
- 5079 Palmera Dr
- 5075 Palmera Dr
- 1419 Woodhaven Dr
- 5083 Palmera Dr
- 5087 Palmera Dr
- 5040 Palmera Dr
- 1415 Woodhaven Dr
- 5051 Palmera Dr
- 5055 Palmera Dr
- 5067 Palmera Dr
- 5047 Palmera Dr
- 5091 Palmera Dr